Kubernetes Solutions
22 May 2019Managing Deployments Using Kubernetes Engine
Introduction to deployments
Heterogeneous deployments typically involve connecting two or more distinct infrastructure environments or regions to address a specific technical or operational need. Heterogeneous deployments are called “hybrid”, “multi-cloud”, or “public-private”, depending upon the specifics of the deployment. For the purposes of this lab, heterogeneous deployments include those that span regions within a single cloud environment, multiple public cloud environments (multi-cloud), or a combination of on-premises and public cloud environments (hybrid or public-private).
Various business and technical challenges can arise in deployments that are limited to a single environment or region:
- Maxed out resources: In any single environment, particularly in on-premises environments, you might not have the compute, networking, and storage resources to meet your production needs.
- Limited geographic reach: Deployments in a single environment require people who are geographically distant from one another to access one deployment. Their traffic might travel around the world to a central location.
- Limited availability: Web-scale traffic patterns challenge applications to remain fault-tolerant and resilient.
- Vendor lock-in: Vendor-level platform and infrastructure abstractions can prevent you from porting applications.
- Inflexible resources: Your resources might be limited to a particular set of compute, storage, or networking offerings.
Heterogeneous deployments can help address these challenges, but they must be architected using programmatic and deterministic processes and procedures. One-off or ad-hoc deployment procedures can cause deployments or processes to be brittle and intolerant of failures. Ad-hoc processes can lose data or drop traffic. Good deployment processes must be repeatable and use proven approaches for managing provisioning, configuration, and maintenance.
Three common scenarios for heterogeneous deployment are multi-cloud deployments, fronting on-premises data, and continuous integration/continuous delivery (CI/CD) processes.
The following exercises practice some common use cases for heterogeneous deployments, along with well-architected approaches using Kubernetes and other infrastructure resources to accomplish them.
gcloud is the command-line tool for Google Cloud Platform. It comes pre-installed on Cloud Shell and supports tab-completion.
You can list the active account name with this command:
gcloud auth list
Output:
Credentialed accounts:
 - <myaccount>@<mydomain>.com (active)
Example output:
Credentialed accounts:
 - google1623327_student@qwiklabs.net
You can list the project ID with this command:
gcloud config list project
Output:
[core]
project = <project_ID>
Example output:
[core]
project = qwiklabs-gcp-44776a13dea667a6
Set zone
Set your working GCP zone by running the following command, substituting the local zone as us-central1-a:
gcloud config set compute/zone us-central1-a
Get sample code for this lab
Get the sample code for creating and running containers and deployments:
git clone https://github.com/googlecodelabs/orchestrate-with-kubernetes.git
cd orchestrate-with-kubernetes/kubernetes
Create a cluster with five n1-standard-1 nodes (this will take a few minutes to complete):
gcloud container clusters create bootcamp --num-nodes 5 --scopes "https://www.googleapis.com/auth/projecthosting,storage-rw"
Learn about the deployment object
Let’s get started with Deployments. First let’s take a look at the Deployment object. The explain command in kubectl can tell us about the Deployment object.
kubectl explain deployment
We can also see all of the fields using the –recursive option.
kubectl explain deployment --recursive
You can use the explain command as you go through the lab to help you understand the structure of a Deployment object and understand what the individual fields do.
kubectl explain deployment.metadata.name
Create a deployment
Update the deployments/auth.yaml cs file:
vi deployments/auth.yaml
Start the editor:
i
Change the image in the containers section of the Deployment to the following:
...
containers:
- name: auth
  image: kelseyhightower/auth:1.0.0
...
Save the auth.yaml file: press <Esc> then:
:wq
Now let’s create a simple deployment. Examine the deployment configuration file:
cat deployments/auth.yaml
(Output)
apiVersion: extensions/v1beta1
kind: Deployment
metadata:
  name: auth
spec:
  replicas: 1
  template:
    metadata:
      labels:
        app: auth
        track: stable
    spec:
      containers:
        - name: auth
          image: "kelseyhightower/auth:1.0.0"
          ports:
            - name: http
              containerPort: 80
            - name: health
              containerPort: 81
...
Notice how the Deployment is creating one replica and it’s using version 1.0.0 of the auth container.
When you run the kubectl create command to create the auth deployment, it will make one pod that conforms to the data in the Deployment manifest. This means we can scale the number of Pods by changing the number specified in the replicas field.
Go ahead and create your deployment object using kubectl create:
kubectl create -f deployments/auth.yaml
Once you have created the Deployment, you can verify that it was created.
kubectl get deployments
Once the deployment is created, Kubernetes will create a ReplicaSet for the Deployment. We can verify that a ReplicaSet was created for our Deployment:
kubectl get replicasets
We should see a ReplicaSet with a name like auth-xxxxxxx
Finally, we can view the Pods that were created as part of our Deployment. The single Pod is created by the Kubernetes when the ReplicaSet is created.
kubectl get pods
It’s time to create a service for our auth deployment. You’ve already seen service manifest files, so we won’t go into the details here. Use the kubectl create command to create the auth service.
kubectl create -f services/auth.yaml
Now, do the same thing to create and expose the hello Deployment.
kubectl create -f deployments/hello.yaml
kubectl create -f services/hello.yaml
And one more time to create and expose the frontend Deployment.
kubectl create secret generic tls-certs --from-file tls/
kubectl create configmap nginx-frontend-conf --from-file=nginx/frontend.conf
kubectl create -f deployments/frontend.yaml
kubectl create -f services/frontend.yaml
Note: You created a ConfigMap for the frontend.
Interact with the frontend by grabbing its external IP and then curling to it.
kubectl get services frontend
curl -ks https://<EXTERNAL-IP>
curl -ks https://35.222.2.201
And you get the hello response back.
You can also use the output templating feature of kubectl to use curl as a one-liner:
curl -ks https://`kubectl get svc frontend -o=jsonpath="{.status.loadBalancer.ingress[0].ip}"`
Scale a Deployment
Now that we have a Deployment created, we can scale it. Do this by updating the spec.replicas field. You can look at an explanation of this field using the kubectl explain command again.
kubectl explain deployment.spec.replicas
The replicas field can be most easily updated using the kubectl scale command:
kubectl scale deployment hello --replicas=5
Note: It may take a minute or so for all the new pods to start up.
After the Deployment is updated, Kubernetes will automatically update the associated ReplicaSet and start new Pods to make the total number of Pods equal 5.
Verify that there are now 5 hello Pods running:
kubectl get pods | grep hello- | wc -l
Now scale back the application:
kubectl scale deployment hello --replicas=3
Again, verify that you have the correct number of Pods.
kubectl get pods | grep hello- | wc -l
You learned about Kubernetes deployments and how to manage & scale a group of Pods.
Rolling update
Deployments support updating images to a new version through a rolling update mechanism. When a Deployment is updated with a new version, it creates a new ReplicaSet and slowly increases the number of replicas in the new ReplicaSet as it decreases the replicas in the old ReplicaSet.
Trigger a rolling update
To update your Deployment, run the following command:
kubectl edit deployment hello
Change the image in the containers section of the Deployment to the following:
...
containers:
- name: hello
  image: kelseyhightower/hello:2.0.0
...
Save and exit.
Once you save out of the editor, the updated Deployment will be saved to your cluster and Kubernetes will begin a rolling update.
See the new ReplicaSet that Kubernetes creates.:
kubectl get replicaset
You can also see a new entry in the rollout history:
kubectl rollout history deployment/hello
Pause a rolling update
If you detect problems with a running rollout, pause it to stop the update. Give that a try now:
kubectl rollout pause deployment/hello
Verify the current state of the rollout:
kubectl rollout status deployment/hello
You can also verify this on the Pods directly:
kubectl get pods -o jsonpath --template='{range .items[*]}{.metadata.name}{"\t"}{"\t"}{.spec.containers[0].image}{"\n"}{end}'
Resume a rolling update
The rollout is paused which means that some pods are at the new version and some pods are at the older version. We can continue the rollout using the resume command.
kubectl rollout resume deployment/hello
When the rollout is complete, you should see the following when running the status command.
kubectl rollout status deployment/hello
(Output)
deployment "hello" successfully rolled out
Rollback an update
Assume that a bug was detected in your new version. Since the new version is presumed to have problems, any users connected to the new Pods will experience those issues.
You will want to roll back to the previous version so you can investigate and then release a version that is fixed properly.
Use the rollout command to roll back to the previous version:
kubectl rollout undo deployment/hello
Verify the roll back in the history:
kubectl rollout history deployment/hello
Finally, verify that all the Pods have rolled back to their previous versions:
kubectl get pods -o jsonpath --template='{range .items[*]}{.metadata.name}{"\t"}{"\t"}{.spec.containers[0].image}{"\n"}{end}'
Great! You learned about rolling updates for Kubernetes deployments and how to update applications without downtime.
Canary deployments
When you want to test a new deployment in production with a subset of your users, use a canary deployment. Canary deployments allow you to release a change to a small subset of your users to mitigate risk associated with new releases.
Create a canary deployment
A canary deployment consists of a separate deployment with your new version and a service that targets both your normal, stable deployment as well as your canary deployment.
First, create a new canary deployment for the new version:
cat deployments/hello-canary.yaml
(Output)
apiVersion: extensions/v1beta1
kind: Deployment
metadata:
  name: hello-canary
spec:
  replicas: 1
  template:
    metadata:
      labels:
        app: hello
        track: canary
        # Use ver 1.0.0 so it matches version on service selector
        version: 1.0.0
    spec:
      containers:
        - name: hello
          image: kelseyhightower/hello:2.0.0
          ports:
            - name: http
              containerPort: 80
            - name: health
              containerPort: 81
...
Make sure to update version to 1.0.0 (if your version is pointing to any other)
Now create the canary deployment:
kubectl create -f deployments/hello-canary.yaml
After the canary deployment is created, you should have two deployments, hello and hello-canary. Verify it with this kubectl command:
kubectl get deployments
On the hello service, the selector uses the app:hello selector which will match pods in both the prod deployment and canary deployment. However, because the canary deployment has a fewer number of pods, it will be visible to fewer users.
Verify the canary deployment
You can verify the hello version being served by the request:
curl -ks https://`kubectl get svc frontend -o=jsonpath="{.status.loadBalancer.ingress[0].ip}"`/version
Run this several times and you should see that some of the requests are served by hello 1.0.0 and a small subset (1/4 = 25%) are served by 2.0.0.
Canary deployments in production - session affinity
In this lab, each request sent to the Nginx service had a chance to be served by the canary deployment. But what if you wanted to ensure that a user didn’t get served by the Canary deployment? A use case could be that the UI for an application changed, and you don’t want to confuse the user. In a case like this, you want the user to “stick” to one deployment or the other.
You can do this by creating a service with session affinity. This way the same user will always be served from the same version. In the example below the service is the same as before, but a new sessionAffinity field has been added, and set to ClientIP. All clients with the same IP address will have their requests sent to the same version of the hello application.
kind: Service
apiVersion: v1
metadata:
  name: "hello"
spec:
  sessionAffinity: ClientIP
  selector:
    app: "hello"
  ports:
    - protocol: "TCP"
      port: 80
      targetPort: 80
Due to it being difficult to set up an environment to test this, you don’t need to here, but you may want to use sessionAffinity for canary deployments in production.
Blue-green deployments
Rolling updates are ideal because they allow you to deploy an application slowly with minimal overhead, minimal performance impact, and minimal downtime. There are instances where it is beneficial to modify the load balancers to point to that new version only after it has been fully deployed. In this case, blue-green deployments are the way to go.
Kubernetes achieves this by creating two separate deployments; one for the old “blue” version and one for the new “green” version. Use your existing hello deployment for the “blue” version. The deployments will be accessed via a Service which will act as the router. Once the new “green” version is up and running, you’ll switch over to using that version by updating the Service.
A major downside of blue-green deployments is that you will need to have at least 2x the resources in your cluster necessary to host your application. Make sure you have enough resources in your cluster before deploying both versions of the application at once.
The service
Use the existing hello service, but update it so that it has a selector app:hello, version: 1.0.0. The selector will match the existing “blue” deployment. But it will not match the “green” deployment because it will use a different version.
First update the service:
kubectl apply -f services/hello-blue.yaml
Updating using Blue-Green Deployment
n order to support a blue-green deployment style, we will create a new “green” deployment for our new version. The green deployment updates the version label and the image path.
apiVersion: extensions/v1beta1
kind: Deployment
metadata:
  name: hello-green
spec:
  replicas: 3
  template:
    metadata:
      labels:
        app: hello
        track: stable
        version: 2.0.0
    spec:
      containers:
        - name: hello
          image: kelseyhightower/hello:2.0.0
          ports:
            - name: http
              containerPort: 80
            - name: health
              containerPort: 81
          resources:
            limits:
              cpu: 0.2
              memory: 10Mi
          livenessProbe:
            httpGet:
              path: /healthz
              port: 81
              scheme: HTTP
            initialDelaySeconds: 5
            periodSeconds: 15
            timeoutSeconds: 5
          readinessProbe:
            httpGet:
              path: /readiness
              port: 81
              scheme: HTTP
            initialDelaySeconds: 5
            timeoutSeconds: 1
Create the green deployment:
kubectl create -f deployments/hello-green.yaml
Once you have a green deployment and it has started up properly, verify that the current version of 1.0.0 is still being used:
curl -ks https://`kubectl get svc frontend -o=jsonpath="{.status.loadBalancer.ingress[0].ip}"`/version
Now, update the service to point to the new version:
kubectl apply -f services/hello-green.yaml
With the service is updated, the “green” deployment will be used immediately. You can now verify that the new version is always being used.
curl -ks https://`kubectl get svc frontend -o=jsonpath="{.status.loadBalancer.ingress[0].ip}"`/version
You did it! You learned about blue-green deployments and how to deploy updates to applications that need to switch versions all at once.
Blue-Green Rollback
If necessary, you can roll back to the old version in the same way. While the “blue” deployment is still running, just update the service back to the old version.
kubectl apply -f services/hello-blue.yaml
Once you have updated the service, your rollback will have been successful. Again, verify that the right version is now being used:
curl -ks https://`kubectl get svc frontend -o=jsonpath="{.status.loadBalancer.ingress[0].ip}"`/version
You did it! You learned about blue-green deployments and how to deploy updates to applications that need to switch versions all at once.
Build a Slack Bot with Node.js on Kubernetes
Get the sample code
In Cloud Shell on the command-line, run the following command to clone the GitHub repository:
git clone https://github.com/googlecodelabs/cloud-slack-bot.git
Change directory into cloud-slack-bot/start:
cd cloud-slack-bot/start
Install the Node.js dependencies, including Botkit:
npm install
Run the sample app
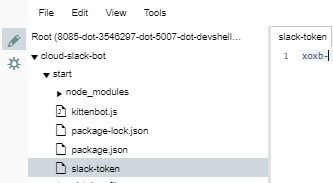
In Cloud Shell, edit the kittenbot.js file and enter your Slack bot token. If it is no longer in your clipboard, you can get it from the bot custom integration configuration page. You can use any editor you like, such as emacs or vim. This lab uses the code editor feature of Cloud Shell for simplicity.
Open the Cloud Shell code editor:
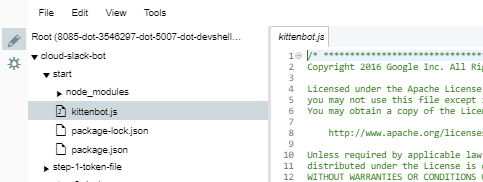
Open the kittenbot.js file by going to cloud-slack-bot/start/kittenbot.js:
Replace your-slack-token (Bot User OAuth Access Token) with the Slack token you copied:
var Botkit = require('botkit')

var controller = Botkit.slackbot({debug: false})
controller
  .spawn({
    token: 'your-slack-token' // Edit this line!
  })
  .startRTM(function (err) {
    if (err) {
      throw new Error(err)
    }
  })

controller.hears(
  ['hello', 'hi'], ['direct_message', 'direct_mention', 'mention'],
  function (bot, message) { bot.reply(message, 'Meow. :smile_cat:') })
Then save the file with Ctrl-s or File > Save.
Note: As you can see in the file, kittenbot will only respond to “hi” and “hello” greetings. Make sure you enter one of those greetings to see it respond.
In Cloud Shell run your bot:
node kittenbot.js
You may see errors in Cloud Shell, but they won’t affect the lab. It’s OK to keep going.
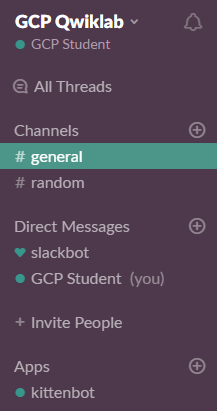
In your Slack workspace, you should now see that kittenbot is online. You may need to refresh your browser. Do the following to interact with it:
Click on the + next to Direct Messages:
Load Slack token from a file
Hard-coding the Slack token in the source code makes it likely to accidentally expose your token by publishing it to version control or embedding it in a docker image. Instead, use Kubernetes Secrets to store tokens.
You will now write your token to a file called slack-token. This filename is in the .gitignore to prevent accidentally checking it in to version control.
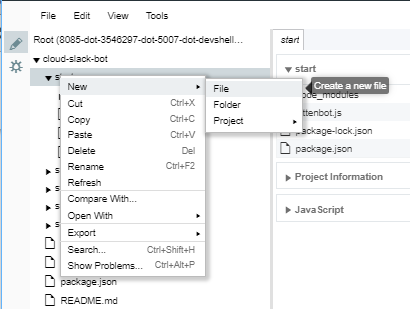
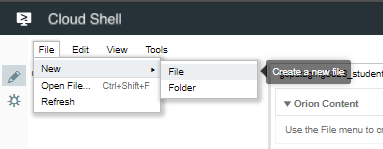
Create a new file in the start directory called slack-token file. (To right-click on a Chromebook: press the touchpad with two fingers, or press Alt while clicking with one finger.)
Copy your token from kittenbot.js or the bot configuration page, paste it into the slack-token file, then Save.
Edit the kittenbot.js file to load the Slack token specified by the slack_token_path environment variable:
var Botkit = require('botkit')
var fs = require('fs') // NEW: Add this require (for loading from files).

var controller = Botkit.slackbot({debug: false})

// START: Load Slack token from file.
if (!process.env.slack_token_path) {
  console.log('Error: Specify slack_token_path in environment')
  process.exit(1)
}

fs.readFile(process.env.slack_token_path, function (err, data) {
  if (err) {
    console.log('Error: Specify token in slack_token_path file')
    process.exit(1)
  }
  data = String(data)
  data = data.replace(/\s/g, '')
  controller
    .spawn({token: data})
    .startRTM(function (err) {
      if (err) {
        throw new Error(err)
      }
    })
})
// END: Load Slack token from file.

controller.hears(
  ['hello', 'hi'], ['direct_message', 'direct_mention', 'mention'],
  function (bot, message) { bot.reply(message, 'Meow. :smile_cat:') })
Go back to the Cloud Console and run your bot:
slack_token_path=./slack-token node kittenbot.js
You should see the bot online again in Slack and be able to chat with it. After testing it out, press Ctrl-c to shut down the bot.
Create a Docker container image
Docker provides a way to containerize your bot. A Docker image bundles all of your dependencies (even the compiled ones) so that it can run in a lightweight sandbox.
Building a Docker image
First, create a file called Dockerfile.
Then add the following definition, which describes how to build your Docker image.
FROM node:10.14
COPY package.json /src/package.json
WORKDIR /src
RUN npm install
COPY kittenbot.js /src
CMD ["node", "/src/kittenbot.js"]
Save this file.
A Dockerfile is a recipe for a Docker image. This one layers on top of the Node.js base image found on the Docker hub, copies package.json to the image and installs the dependencies listed in it, copies the kittenbot.js file to the image, and tells Docker that it should run the Node.js server when the image starts.
Go back to the Cloud Shell and run this command to save your project ID to the environment variable PROJECT_ID. Commands in this lab will use this variable as $PROJECT_ID.
export PROJECT_ID=$(gcloud config list --format 'value(core.project)')
Build the image by running the docker build command. (This command takes about 4 minutes to complete. It has to download the base image and Node.js dependencies.)
docker build -t gcr.io/${PROJECT_ID}/slack-codelab:v1 .
While the Docker image is building, try this out this Extra Credit exercise to get a webhook to use later in the lab.
Extra Credit: Create an incoming webhook to Slack
An incoming webhook is an easy way to send Slack notifications from another service or app without having to worry about a persistent connection for two-way communication like with a bot user. Create one now:
Go to the Slack apps management page.
Click on your app Kittenbot, and then in the left panel, click Incoming Webhooks.
Toggle Activate Incoming Webhooks to On.
At the top, there’s a message “You’ve changed the permissions scopes …”. Click click here.
From the Post to dropdown, select the Slack channel #general for messages to post to.
Click Authorize.
Copy the webhook URL and save it to your computer. You’ll come back to this in a later step.
Testing a Docker image locally
Go back to Cloud Shell to test the image locally with the following command. It will run a Docker container as a daemon from the newly-created container image:
docker run -d \
    -v $(pwd)/:/config \
    -e slack_token_path=/config/slack-token \
    gcr.io/${PROJECT_ID}/slack-codelab:v1
This command also mounts the current directory as a volume inside the container to give it access to the slack-token file. You should see that kittenbot is online again.
Here’s the full documentation for the docker run command: https://docs.docker.com/engine/reference/run/
Frequently asked question: How do I get the project ID from the gcloud command-line tool?
Pushing a Docker image to Google Container Registry
Now that the image works as intended, push it to the Google Container Registry, a private repository for your Docker images accessible from every Google Cloud project (but also from outside Google Cloud Platform).
Push the Docker image to Google Container Registry from Cloud Shell:
gcloud docker -- push gcr.io/${PROJECT_ID}/slack-codelab:v1
(This command takes about 5 minutes to complete.)
Extra Credit: Testing an incoming webhook
While waiting for the image to upload, use the incoming webhook to send a notification to Slack.
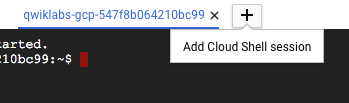
In Cloud Shell, click the + button tab to add a new Cloud Shell session:
Go back to the incoming webhook you created. (If you closed that browser tab you can get back to there from the Slack apps management page, click your app, Kittenbot, and in the left pand, click Incoming Webhooks.)
From the Incoming Webhooks page, click the Copy button for the “Sample curl request to post to a channel”, and paste it into the new Cloud Shell Session.
This will run curl to send an HTTP request with your message to Slack.
In your Slack app, in the #general channel, look for a message from kittenbot.
This demonstrates that anywhere that you can send an HTTP request, you can send a message to Slack. This is a really easy way to integrate your own apps and services with Slack notifications.
For more complicated messages, test out the JSON request first in the Slack message builder.
Viewing images in Google Container Registry
When the image upload completes, you can see it listed in the Google Cloud Console. Under the Tools section, click on Container Registry > Images.
You now have a project-wide Docker image available which Kubernetes can access and orchestrate.
Notice a generic domain was used for the registry (gcr.io). You can also be more specific about which zone and bucket to use. Details are documented here: https://cloud.google.com/container-registry/#pushing_to_the_registry
If you’re curious, you can navigate through the container images as they are stored in Google Cloud Storage by following this link: https://console.cloud.google.com/storage/browser/.
Frequently Asked Questions:
-
Troubleshooting Google Container Registry (Unable to ping registry endpoint).
-
“Repository does not exist” error when doing gcloud docker push command.
Create a Kubernetes cluster on Kubernetes Engine
Now that the Docker image is in Google Container Registry, you can run the gcloud docker – pull command to save this image on any machine and run it with the Docker command-line tool.
If you want to make sure your bot keeps running after it is started, you’ll have to run another service to monitor your Docker container to restart it if it stops. This gets harder if you want to make sure the bot keeps running even if the machine it is running on fails.
Kubernetes solves these problems. You tell it that you want there to always be a replica of your bot running, and the Kubernetes master will keep that target state. It starts the bot up when there aren’t enough running, and shuts bot replicas down when there are too many.
A Kubernetes Engine cluster is a managed Kubernetes cluster. It consists of a Kubernetes master API server hosted by Google and a set of worker nodes. The worker nodes are Compute Engine virtual machines.
Return to the first Cloud Shell if you tried the extra credit.
Create a cluster with two n1-standard-1 nodes (this will take a few minutes to complete):
gcloud container clusters create my-cluster \
      --num-nodes=2 \
      --zone=us-central1-f \
      --machine-type n1-standard-1
(Output)
Creating cluster my-cluster...done.
Created [https://container.googleapis.com/v1/projects/PROJECT_ID/zones/us-central1-f/clusters/my-cluster].
kubeconfig entry generated for my-cluster.
NAME        ZONE           MACHINE_TYPE   NUM_NODES  STATUS
my-cluster  us-central1-f  n1-standard-1  2          RUNNING
Alternatively, you could create this cluster via the Cloud Console:
Kubernetes Engine > Kubernetes clusters > Create cluster.
If you use the Cloud Console to create the cluster, run gcloud container clusters get-credentials my-cluster --zone=us-central1-f to authenticate Cloud Shell with the cluster credentials.
This command creates the cluster and authenticates the Kubernetes command-line tool, kubectl, with the new cluster’s credentials.
You should now have a fully-functioning Kubernetes cluster powered by Kubernetes Engine. You’ll see it in the Cloud Console in Kubernetes Engine > Kubernetes clusters.
Each node in the cluster is a Compute Engine instance provisioned with Kubernetes and Docker binaries. If you are curious, you can list all Compute Engine instances in the project:
gcloud compute instances list
(Output)
NAME           ZONE          MACHINE_TYPE  INTERNAL_IP EXTERNAL_IP     STATUS
gke-my-cl...16 us-central1-f n1-standard-1 10.240.0.2  146.148.100.240 RUNNING
gke-my-cl...34 us-central1-f n1-standard-1 10.240.0.3  104.154.36.108  RUNNING
For the rest of this lab you’ll use kubectl, the Kubernetes command-line tool, to configure and run your bot.
Create a Deployment
First, create a Secret in Kubernetes to store the Slack token and make it available to the container:
kubectl create secret generic slack-token --from-file=./slack-token
(Output)
secret "slack-token" created
To deploy your own containerized application to the Kubernetes cluster you need to configure a Deployment, which describes how to configure the container and provide a replication controller to keep the bot running.
In the Cloud Shell Code Editor, create a file called slack-codelab-deployment.yaml.
Enter the following deployment definition, replacing PROJECT_ID with your Project ID:
apiVersion: extensions/v1beta1
kind: Deployment
metadata:
  name: slack-codelab
spec:
  replicas: 1
  strategy:
    type: Recreate
  template:
    metadata:
      labels:
        app: slack-codelab
    spec:
      containers:
      - name: master
        image: gcr.io/PROJECT_ID/slack-codelab:v1  # Replace PROJECT_ID
                                                   # with your project ID.
        volumeMounts:
        - name: slack-token
          mountPath: /etc/slack-token
        env:
        - name: slack_token_path
          value: /etc/slack-token/slack-token
      volumes:
      - name: slack-token
        secret:
          secretName: slack-token
Save the file, File > Save.
Now you can create the Deployment by running kubectl create in Cloud Shell:
kubectl create -f slack-codelab-deployment.yaml --record
(Output)
deployment "slack-codelab" created
Since you used the –record option, you can view the commands applied to this deployment as the “change-cause” in the rollout history:
kubectl rollout history deployment/slack-codelab
(Output)
deployments "slack-codelab":
REVISION        CHANGE-CAUSE
1               kubectl create -f slack-codelab-deployment.yaml --record
See what the kubectl create command made. Re-run this command until the status shows Running.
kubectl get pods
This should take about 30 seconds to 1 minute
(Output)
NAME                             READY     STATUS    RESTARTS   AGE
slack-codelab-2890463383-1ss4a   1/1       Running   0          3m
The last things you need to do:
- Re-run kubectl get pods until the status for the pod shows Running.
- Go to Slack, and see that kittenbot is back online.
- Say hello to kittenbot one last time in a direct message.
Frequently asked questions:
Extra Credit: Update your bot to a new version
This extra credit section should take you about 10 minutes to complete. So you’d like the bot to do more than just say “meow”. How do you deploy a new version of something that is already running on Kubernetes? First, you need to modify the application. Botkit can handle conversations. With these, the bot can request more information and react to messages beyond a one word reply.
Edit the kittenbot.js file in the code editor. Add this new kitten emoji delivery code to the bottom of the file:
// ...

// START: listen for cat emoji delivery
var maxCats = 20
var catEmojis = [
  ':smile_cat:',
  ':smiley_cat:',
  ':joy_cat:',
  ':heart_eyes_cat:',
  ':smirk_cat:',
  ':kissing_cat:',
  ':scream_cat:',
  ':crying_cat_face:',
  ':pouting_cat:',
  ':cat:',
  ':cat2:',
  ':leopard:',
  ':lion_face:',
  ':tiger:',
  ':tiger2:'
]

controller.hears(
  ['cat', 'cats', 'kitten', 'kittens'],
  ['ambient', 'direct_message', 'direct_mention', 'mention'],
  function (bot, message) {
    bot.startConversation(message, function (err, convo) {
      if (err) {
        console.log(err)
        return
      }
      convo.ask('Does someone need a kitten delivery? Say YES or NO.', [
        {
          pattern: bot.utterances.yes,
          callback: function (response, convo) {
            convo.say('Great!')
            convo.ask('How many?', [
              {
                pattern: '[0-9]+',
                callback: function (response, convo) {
                  var numCats =
                  parseInt(response.text.replace(/[^0-9]/g, ''), 10)
                  if (numCats === 0) {
                    convo.say({
                      'text': 'Sorry to hear you want zero kittens. ' +
                        'Here is a dog, instead. :dog:',
                      'attachments': [
                        {
                          'fallback': 'Chihuahua Bubbles - https://youtu.be/s84dBopsIe4',
                          'text': '<https://youtu.be/s84dBopsIe4|' +
                            'Chihuahua Bubbles>!'
                        }
                      ]
                    })
                  } else if (numCats > maxCats) {
                    convo.say('Sorry, ' + numCats + ' is too many cats.')
                  } else {
                    var catMessage = ''
                    for (var i = 0; i < numCats; i++) {
                      catMessage = catMessage +
                      catEmojis[Math.floor(Math.random() * catEmojis.length)]
                    }
                    convo.say(catMessage)
                  }
                  convo.next()
                }
              },
              {
                default: true,
                callback: function (response, convo) {
                  convo.say(
                    "Sorry, I didn't understand that. Enter a number, please.")
                  convo.repeat()
                  convo.next()
                }
              }
            ])
            convo.next()
          }
        },
        {
          pattern: bot.utterances.no,
          callback: function (response, convo) {
            convo.say('Perhaps later.')
            convo.next()
          }
        },
        {
          default: true,
          callback: function (response, convo) {
            // Repeat the question.
            convo.repeat()
            convo.next()
          }
        }
      ])
    })
  })
  // END: listen for cat emoji delivery
Then Save the file.
You can test this out in Cloud Shell using the same command as before, but you’ll see two responses since the bot is still running in your Kubernetes cluster.
Next, build a new container image with an incremented tag (v2 in this case):
docker build -t gcr.io/${PROJECT_ID}/slack-codelab:v2 .
Push the image to Google Container Registry:
gcloud docker -- push gcr.io/${PROJECT_ID}/slack-codelab:v2
Building and pushing this updated image should be much quicker, taking full advantage of caching.
As you did with the first version of the kitten bot, you can test locally using the node command and the docker command. You can skip those steps and push the new version to the cluster.
Now you’re ready for Kubernetes to update the deployment to the new version of the application.
Edit the line in the slack-codelab-deployment.yaml file defining which image to use:
apiVersion: extensions/v1beta1
kind: Deployment
metadata:
  name: slack-codelab
spec:
  replicas: 1
  strategy:
    type: Recreate
  template:
    metadata:
      labels:
        app: slack-codelab
    spec:
      containers:
      - name: master
        image: gcr.io/PROJECT_ID/slack-codelab:v2  # Update this to v2.
                                                   # Replace PROJECT_ID
                                                   # with your project ID.
        volumeMounts:
        - name: slack-token
          mountPath: /etc/slack-token
        env:
        - name: slack_token_path
          value: /etc/slack-token/slack-token
      volumes:
      - name: slack-token
        secret:
          secretName: slack-token
Save the file.
Now, to apply this change to the running Deployment, run this command to update the deployment to use the v2 image:
kubectl apply -f slack-codelab-deployment.yaml
(Output)
deployment "slack-codelab" configured
Use this code to see that Kubernetes has shut down the pod running the previous version and started a new pod that is running the new image:
kubectl get pods
(Output)
NAME                             READY     STATUS        RESTARTS   AGE
slack-codelab-2890463383-mqy5l   1/1       Terminating   0          17m
slack-codelab-3059677337-b41r0   1/1       Running       0          7s
Deployment Strategies: Since the deployment strategy was specified to “recreate” when you created the deployment, Kubernetes makes sure the old instances are shut down before creating a new one. This strategy is used because:
- we don’t mind a few seconds of downtime and
- we don’t want two custom integration bots running at the same time. Alternatively, a rolling update strategy could have been used, which ensures that new versions are running before shutting down the old versions. This would be ideal if creating a Slack App used by multiple teams.
See the changed deployment:
kubectl rollout history deployment/slack-codelab
(Output)
deployments "slack-codelab":
REVISION        CHANGE-CAUSE
1               kubectl create -f slack-codelab-deployment.yaml --record
2               kubectl apply -f slack-codelab-deployment.yaml
Go back to Slack and type a message to kittenbot that mentions “kitten” and see it join the conversation.
You just updated a Slack bot running on Kubernetes to a new version.
Using Kubernetes Engine to Deploy Apps with Regional Persistent Disks
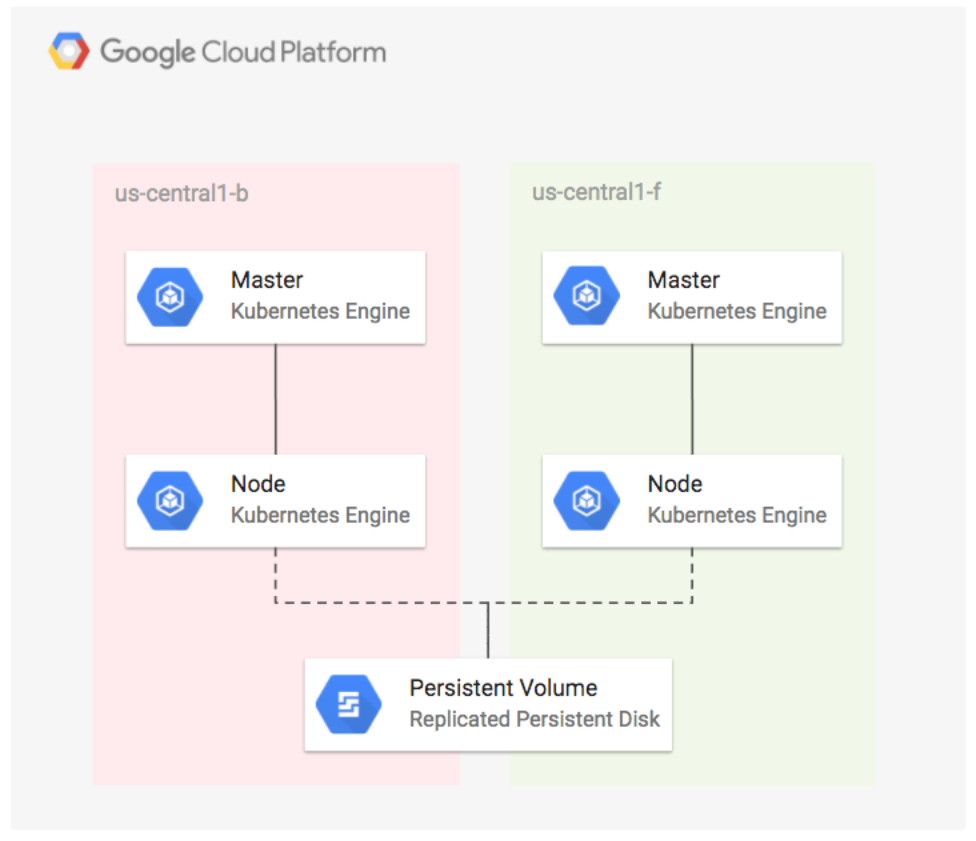
Overview
In this lab you will learn how to configure a highly available application by deploying WordPress using regional persistent disks on Kubernetes Engine. Regional persistent disks provide synchronous replication between two zones, which keeps your application up and running in case there is an outage or failure in a single zone. Deploying a Kubernetes Engine Cluster with regional persistent disks will make your application more stable, secure, and reliable.
What you’ll do
- Create a regional Kubernetes Engine cluster.
- Create a Kubernetes StorageClass resource that is configured for replicated zones.
- Deploy WordPress with a regional disk that uses the StorageClass.
- Simulate a zone failure by deleting a node.
- Verify that the WordPress app and data migrate successfully to another replicated zone.
Prerequisites
This is an advanced lab. Before taking it, you should be familiar with at least the basics of Kubernetes and WordPress. Here are some Qwiklabs that can get you up to speed:
- Kubernetes Engine: Qwik Start
- Running WordPress on App Engine Flexible Environment
- Hello Node Kubernetes
Once you’re prepared, scroll down to get your lab environment set up.
Creating the Regional Kubernetes Engine Cluster
Open a new Cloud Shell session. You will first create a regional Kubernetes Engine cluster that spans three zones in the us-west1 region. First, fetch the server configuration for the us-west1 region and export environment variables by running:
CLUSTER_VERSION=$(gcloud container get-server-config --region us-west1 --format='value(validMasterVersions[0])')

export CLOUDSDK_CONTAINER_USE_V1_API_CLIENT=false
Now create a standard Kubernetes Engine cluster (this will take a little while, ignore any warnings about node auto repairs):
gcloud container clusters create repd \
  --cluster-version=${CLUSTER_VERSION} \
  --machine-type=n1-standard-4 \
  --region=us-west1 \
  --num-nodes=1 \
  --node-locations=us-west1-a,us-west1-b,us-west1-c
Example Output:
Creating cluster repd...done.
Created [https://container.googleapis.com/v1beta1/projects/qwiklabs-gcp-e8f5f22705c770ab/zones/us-west1/clusters/repd].
To inspect the contents of your cluster, go to: https://console.cloud.google.com/kubernetes/workload_/gcloud/us-west1/repd?project=qwiklabs-gcp-e8f5f22705c770ab
kubeconfig entry generated for repd.
NAME  LOCATION  MASTER_VERSION  MASTER_IP      MACHINE_TYPE   NODE_VERSION  NUM_NODES  STATUS
repd  us-west1  1.12.6-gke.7    35.247.50.133  n1-standard-4  1.12.6-gke.7  3          RUNNING
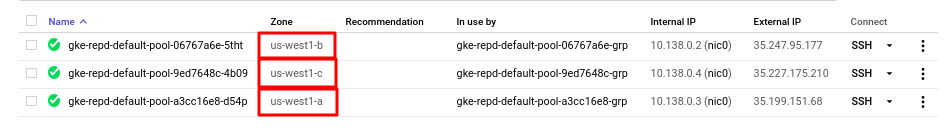
You just created a regional cluster (located in us-west1) with one node in each zone (us-west1-a,us-west1-b,us-west1-c). Navigate to Compute Engine from the left-hand menu to view your instances:
Deploying the App with a Regional Disk
Now that you have your Kubernetes cluster running, you’ll do the following three things:
- Install Helm (a toolset for managing Kubernetes packages)
- Create the Kubernetes StorageClass that is used by the regional persistent disk
- Deploy WordPres
Install and initialize Helm to install the chart package
The chart package, which is installed with Helm, contains everything you need to run WordPress.
- Install Helm locally in your Cloud Shell instance by running:
curl https://raw.githubusercontent.com/kubernetes/helm/master/scripts/get > get_helm.sh
chmod 700 get_helm.sh
./get_helm.sh
Initialize Helm: ``` kubectl create serviceaccount tiller –namespace kube-system
kubectl create clusterrolebinding tiller-cluster-rule \ –clusterrole=cluster-admin \ –serviceaccount=kube-system:tiller helm init –service-account=tiller until (helm version –tiller-connection-timeout=1 >/dev/null 2>&1); do echo “Waiting for tiller install…”; sleep 2; done && echo “Helm install complete”
Helm is now installed in your cluster.

#### Create the StorageClass
Next you'll create the StorageClass used by the chart to define the zones of the regional disk. The zones listed in the StorageClass will match the zones of the Kubernetes Engine cluster.

Create a StorageClass for the regional disk by running:
kubectl apply -f - «EOF kind: StorageClass apiVersion: storage.k8s.io/v1 metadata: name: repd-west1-a-b-c provisioner: kubernetes.io/gce-pd parameters: type: pd-standard replication-type: regional-pd zones: us-west1-a, us-west1-b, us-west1-c EOF
Example Output:
storageclass “repd-west1-a-b-c” created
You now have a StorageClass that is capable of provisioning PersistentVolumes that are replicated across the us-west1-a, us-west1-b and us-west1-c zones.

List the available `storageclass` with:
kubectl get storageclass
Example Output:
NAME PROVISIONER AGE repd-west1-a-b-c kubernetes.io/gce-pd 26s standard (default) kubernetes.io/gce-pd 1h
### Create Persistent Volume Claims
In this section, you will create persistentvolumeclaims for your application.

Create data-wp-repd-mariadb-0 PVC with standard StorageClass.
kubectl apply -f - «EOF kind: PersistentVolumeClaim apiVersion: v1 metadata: name: data-wp-repd-mariadb-0 namespace: default labels: app: mariadb component: master release: wp-repd spec: accessModes: - ReadOnlyMany resources: requests: storage: 8Gi storageClassName: standard EOF
Create `wp-repd-wordpress` PVC with `repd-west1-a-b-c` StorageClass.
kubectl apply -f - «EOF kind: PersistentVolumeClaim apiVersion: v1 metadata: name: wp-repd-wordpress namespace: default labels: app: wp-repd-wordpress chart: wordpress-5.7.1 heritage: Tiller release: wp-repd spec: accessModes: - ReadOnlyMany resources: requests: storage: 200Gi storageClassName: repd-west1-a-b-c EOF
List the available `persistentvolumeclaims` with:
kubectl get persistentvolumeclaims
Example Output:
NAME STATUS VOLUME CAPACITY ACCESS MODES STORAGECLASS AGE data-wp-repd-mariadb-0 Bound pvc-8a10ed04-56ca-11e9-a020-42010a8a003d 8Gi ROX standard 21m wp-repd-wordpress Bound pvc-ad5ddb0b-56ca-11e9-9af5-42010a8a0047 200Gi ROX repd-west1-a-b-c 20m
Deploy WordPress
Now that we have our StorageClass configured, Kubernetes automatically attaches the persistent disk to an appropriate node in one of the available zones.

1. Deploy the WordPress chart that is configured to use the StorageClass that you created earlier:
helm install –name wp-repd \ –set smtpHost= –set smtpPort= –set smtpUser= \ –set smtpPassword= –set smtpUsername= –set smtpProtocol= \ –set persistence.storageClass=repd-west1-a-b-c \ –set persistence.existingClaim=wp-repd-wordpress \ –set persistence.accessMode=ReadOnlyMany \ stable/wordpress
Output:
NAME: wp-repd LAST DEPLOYED: Fri May 24 09:14:55 2019 NAMESPACE: default STATUS: DEPLOYED
RESOURCES: ==> v1/ConfigMap NAME DATA AGE wp-repd-mariadb 1 1s wp-repd-mariadb-tests 1 1s
==> v1/Deployment NAME READY UP-TO-DATE AVAILABLE AGE wp-repd-wordpress 0/1 1 0 1s
==> v1/Pod(related) NAME READY STATUS RESTARTS AGE wp-repd-mariadb-0 0/1 ContainerCreating 0 1s wp-repd-wordpress-7889b789f-l2skn 0/1 ContainerCreating 0 1s
==> v1/Secret NAME TYPE DATA AGE wp-repd-mariadb Opaque 2 1s wp-repd-wordpress Opaque 1 1s
==> v1/Service
NAME TYPE CLUSTER-IP EXTERNAL-IP PORT(S) AGE
wp-repd-mariadb ClusterIP 10.23.249.165
==> v1beta1/StatefulSet NAME READY AGE wp-repd-mariadb 0/1 1s
NOTES:
- Get the WordPress URL:
NOTE: It may take a few minutes for the LoadBalancer IP to be available. Watch the status with: ‘kubectl get svc –namespace default -w wp-repd-wordpress’ export SERVICE_IP=$(kubectl get svc –namespace default wp-repd-wordpress –template “”) echo “WordPress URL: http://$SERVICE_IP/” echo “WordPress Admin URL: http://$SERVICE_IP/admin”
- Login with the following credentials to see your blog
echo Username: user echo Password: $(kubectl get secret –namespace default wp-repd-wordpress -o jsonpath=”{.data.wordpress-password}” | base64 –decode)
2. List out available wordpress pods:
kubectl get pods
Example Output:
NAME READY STATUS RESTARTS AGE wp-repd-mariadb-79444cd49b-lx8jq 1/1 Running 0 35m wp-repd-wordpress-7654c85b66-gz6nd 1/1 Running 0 35m
3. Run the following command which waits for the service load balancer's external IP address to be created:
while [[ -z $SERVICE_IP ]]; do SERVICE_IP=$(kubectl get svc wp-repd-wordpress -o jsonpath=’{.status.loadBalancer.ingress[].ip}’); echo “Waiting for service external IP…”; sleep 2; done; echo http://$SERVICE_IP/admin
4. Verify that the persistent disk was created:
while [[ -z $PV ]]; do PV=$(kubectl get pvc wp-repd-wordpress -o jsonpath=’{.spec.volumeName}’); echo “Waiting for PV…”; sleep 2; done
kubectl describe pv $PV
### Simulating a zone failure
Next you will simulate a zone failure and watch Kubernetes move your workload to the other zone and attach the regional disk to the new node.

1. Obtain the current node of the WordPress pod:
NODE=$(kubectl get pods -l app=wp-repd-wordpress -o jsonpath=’{.items..spec.nodeName}’)
ZONE=$(kubectl get node $NODE -o jsonpath=”{.metadata.labels[‘failure-domain.beta.kubernetes.io/zone’]}”)
IG=$(gcloud compute instance-groups list –filter=”name~gke-repd-default-pool zone:(${ZONE})” –format=’value(name)’)
echo “Pod is currently on node ${NODE}”
echo “Instance group to delete: ${IG} for zone: ${ZONE}”
Example Output:
Pod is currently on node gke-repd-default-pool-b8cf37cd-bc5q Instance group to delete: gke-repd-default-pool-b8cf37cd-grp for zone: us-west1-c
You can also verify it with:
kubectl get pods -l app=wp-repd-wordpress -o wide
Example Output:
NAME READY STATUS RESTARTS AGE IP NODE wp-repd-wordpress-7654c85b66-gz6nd 1/1 Running 0 1h 10.20.0.11 gke-repd-default-pool-b8cf37cd-bc5q
Take note of `Node` column. You are going to delete this node to simulate the zone failure.


2. Now run the following to delete the instance group for the node where the WordPress pod is running, click **Y** to continue deleting:
gcloud compute instance-groups managed delete ${IG} –zone ${ZONE}
Kubernetes is now detecting the failure and migrates the pod to a node in another zone.

3. Verify that both the WordPress pod and the persistent volume migrated to the node that is in the other zone:
kubectl get pods -l app=wp-repd-wordpress -o wide
Example Output:
NAME READY STATUS RESTARTS AGE IP NODE wp-repd-wordpress-7654c85b66-xqb78 1/1 Running 0 1m 10.20.1.14 gke-repd-default-pool-9da1b683-h70h
Make sure the node that is displayed is different from the node in the previous step.


4. Once the new service has a Running status, open the WordPress admin page in your browser from the link displayed in the command output:
echo http://$SERVICE_IP/admin
You have attached a regional persistent disk to a node that is in a different zone.


## NGINX Ingress Controller on Google Kubernetes Engine

### Set a zone
Before creating a Kubernetes cluster, we'll have to set a default computing zone for our GCP project. Run the following command to see a [list of GCP zones](https://cloud.google.com/compute/docs/regions-zones/):
gcloud compute zones list
Now run the following command to set your zone (in this case to us-central1-a):
gcloud config set compute/zone us-central1-a
### Create a Kubernetes cluster
Now that our zone is configured, let's deploy a Kubernetes Engine cluster. Run the following command to create a cluster named nginx-tutorial that's made up of two nodes (or worker machines):
gcloud container clusters create nginx-tutorial –num-nodes 2
It will take a few minutes for this command to complete. Continue when you get a similar output in Cloud Shell:

### Install Helm
Now that we have our Kubernetes cluster up and running, let's install [Helm](https://helm.sh/). Helm is a tool that streamlines Kubernetes application installation and management. You can think of it like apt, yum, or homebrew for Kubernetes. Using helm charts is recommended, since they are maintained and typically kept up-to-date by the Kubernetes community. Helm has two parts: a client (helm) and a server (tiller):
* **Tiller** runs inside your Kubernetes cluster and manages releases (installations) of your Helm Charts.
* **Helm** runs on your laptop, CI/CD, or in this case, the Cloud Shell.
Helm comes preconfigured with an installer script that automatically grabs the latest version of the Helm client and installs it locally. Fetch the script by running the following command:
curl https://raw.githubusercontent.com/kubernetes/helm/master/scripts/get > get_helm.sh
Next, run the following commands to get the Helm client installed:
chmod 700 get_helm.sh ./get_helm.sh
Now initialize helm:
helm init
Great! You now have the latest copy of the Helm client installed and ready for use in your Cloud Shell environment.


### Installing Tiller
Starting with Kubernetes v1.8+, [RBAC](https://en.wikipedia.org/wiki/Role-based_access_control) is enabled by default. Prior to installing tiller you need to ensure that you have the correct ServiceAccount and ClusterRoleBinding configured for the tiller service. This allows tiller to be able to install services in the default namespace.

Run the following commands to install the server-side tiller to the Kubernetes cluster with RBAC enabled:
kubectl create serviceaccount –namespace kube-system tiller
kubectl create clusterrolebinding tiller-cluster-rule –clusterrole=cluster-admin –serviceaccount=kube-system:tiller
kubectl patch deploy –namespace kube-system tiller-deploy -p ‘{“spec”:{“template”:{“spec”:{“serviceAccount”:”tiller”}}}}’
Now initialize Helm with your newly-created service account:
helm init –service-account tiller –upgrade
You can also confirm that tiller is running by checking for the tiller-deploy Deployment in the kube-system namespace. Run the following command to do so:
kubectl get deployments -n kube-system
The output should have a tiller-deploy Deployment as shown below:
NAME DESIRED CURRENT UP-TO-DATE AVAILABLE AGE event-exporter-v0.1.7 1 1 1 1 13m heapster-v1.4.3 1 1 1 1 13m kube-dns 2 2 2 2 13m kube-dns-autoscaler 1 1 1 1 13m kubernetes-dashboard 1 1 1 1 13m l7-default-backend 1 1 1 1 13m tiller-deploy 1 1 1 1 4m
### Deploy an application in Kubernetes Engine
Now that you have Helm configured, let's deploy a simple web-based application from the Google Cloud Repository. This application will be used as the backend for the Ingress.

From the Cloud Shell, run the following command:
kubectl run hello-app –image=gcr.io/google-samples/hello-app:1.0 –port=8080
Your output should resemble the following:
deployment “hello-app” created
Now expose the hello-app Deployment as a Service by running the following command:
kubectl expose deployment hello-app
Your output should resemble the following:
service “hello-app” exposed
### Deploying the NGINX Ingress Controller via Helm
The Kubernetes platform gives administrators flexibility when it comes to Ingress Controllers—you can integrate your own rather than having to work with your provider's built-in offering. The NGINX controller must be exposed for external access. This is done using Service `type: LoadBalancer` on the NGINX controller service. On Kubernetes Engine, this creates a Google Cloud Network (TCP/IP) Load Balancer with NGINX controller Service as a backend. Google Cloud also creates the appropriate firewall rules within the Service's VPC to allow web HTTP(S) traffic to the load balancer frontend IP address.
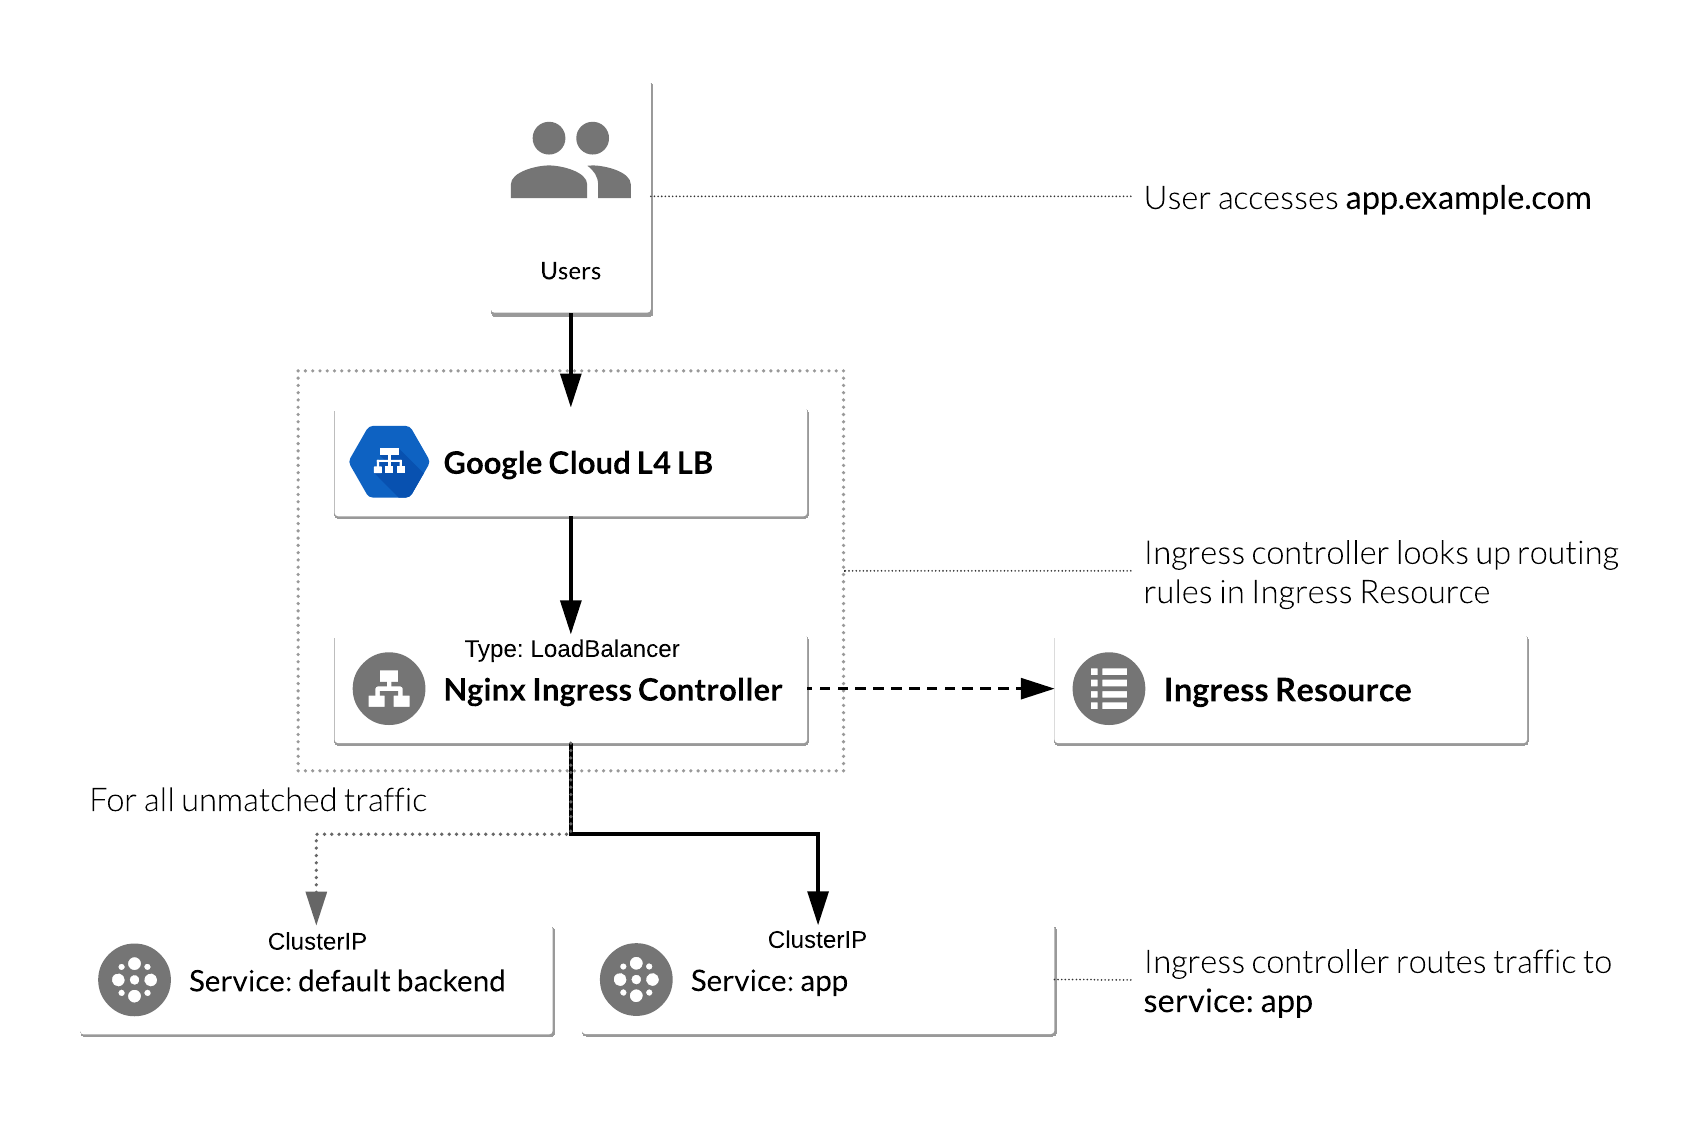
#### NGINX Ingress Controller on Kubernetes Engine
The following flowchart is a visual representation of how an NGINX controller runs on a Kubernetes Engine cluster:
#### Deploy NGINX Ingress Controller
Now that you have the bigger picture in mind, let's go ahead and deploy the NGINX Ingress Controller. Run the following command to do so:
helm install –name nginx-ingress stable/nginx-ingress –set rbac.create=true
In the output under RESOURCES, you should see a similar output:
==> v1/Service
NAME TYPE CLUSTER-IP EXTERNAL-IP PORT(S) AGE
nginx-ingress-controller LoadBalancer 10.15.252.129
Note the second service, `nginx-ingress-default-backend`. The default backend is a Service which handles all URL paths and hosts the NGINX controller. The default backend exposes two URLs:

* `/healthz` that returns 200
* `/` that returns 404


Wait a few moments while the GCP L4 Load Balancer gets deployed. Confirm that the `nginx-ingress-controller` Service has been deployed and that you have an external IP address associated with the service by running the following command:
kubectl get service nginx-ingress-controller
You receive a similar output:
NAME TYPE CLUSTER-IP EXTERNAL-IP
nginx-ingress-controller LoadBalancer 10.7.248.226 35.226.162.176
### Configure Ingress Resource to use NGINX Ingress Controller
An Ingress Resource object is a collection of L7 rules for routing inbound traffic to Kubernetes Services. Multiple rules can be defined in one Ingress Resource or they can be split up into multiple Ingress Resource manifests. The Ingress Resource also determines which controller to utilize to serve traffic. This can be set with an annotation, `kubernetes.io/ingress.class`, in the metadata section of the Ingress Resource. For the NGINX controller, you will use the nginx value as shown below:
annotations: kubernetes.io/ingress.class: nginx
On Kubernetes Engine, if no annotation is defined under the metadata section, the Ingress Resource uses the GCP GCLB L7 load balancer to serve traffic. This method can also be forced by setting the annotation's value to gce, like below:
annotations: kubernetes.io/ingress.class: gce
Let's create a simple Ingress Resource YAML file which uses the NGINX Ingress Controller and has one path rule defined by typing the following commands:
touch ingress-resource.yaml nano ingress-resource.yaml
Add the following content in `ingress-resource.yaml` file:
apiVersion: extensions/v1beta1 kind: Ingress metadata: name: ingress-resource annotations: kubernetes.io/ingress.class: nginx nginx.ingress.kubernetes.io/ssl-redirect: “false” spec: rules:
- http:
paths:
- path: /hello backend: serviceName: hello-app servicePort: 8080 ```
then press Ctrl-X, then press Y, then press Enter to save the file.
The kind: Ingress dictates it is an Ingress Resource object. This Ingress Resource defines an inbound L7 rule for path /hello to service hello-app on port 8080.
Run the following command to apply those rules to our Kubernetes application:
kubectl apply -f ingress-resource.yaml
Verify that Ingress Resource has been created:
kubectl get ingress ingress-resource
Note: The IP address for the Ingress Resource will not be defined right away. Wait a few moments for the
ADDRESSfield to get populated.
Test Ingress and default backend
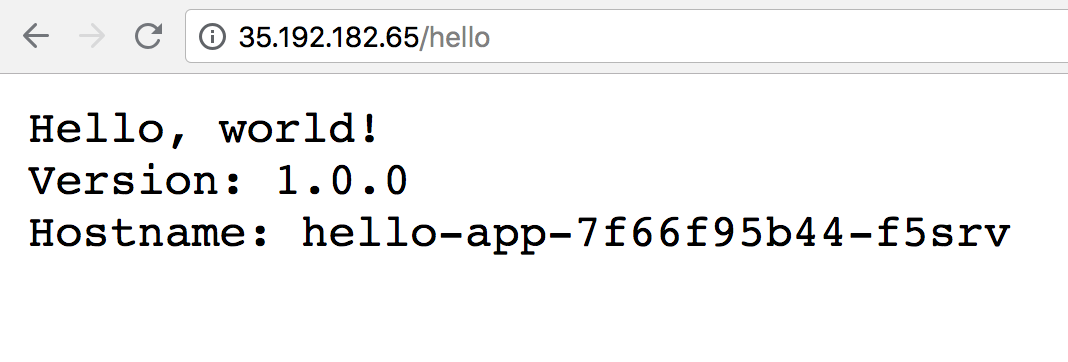
You should now be able to access the web application by going to the EXTERNAL-IP/hello address of the NGINX ingress controller (found by running kubectl get service nginx-ingress-controller).
Open a new tab and go to the following, replacing the external-ip-of-ingress-controller with the external IP address of the NGINX ingress controller:
http://external-ip-of-ingress-controller/hello
Your page should look similar to the following:
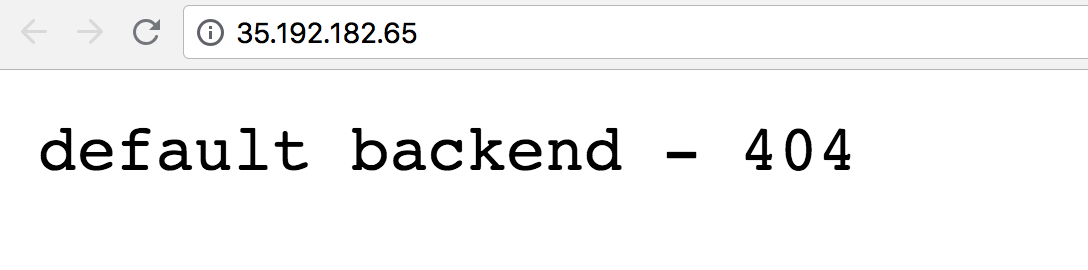
To check if the default-backend service is working properly, access any path (other than the path /hello defined in the Ingress Resource) and ensure you receive a 404 message. For example:
http://external-ip-of-ingress-controller/test
Your page should look similar to the following:
Distributed Load Testing Using Kubernetes
Overview
In this lab you will learn how to use Kubernetes Engine to deploy a distributed load testing framework. The framework uses multiple containers to create load testing traffic for a simple REST-based API. Although this solution tests a simple web application, the same pattern can be used to create more complex load testing scenarios such as gaming or Internet-of-Things (IoT) applications. This solution discusses the general architecture of a container-based load testing framework.
System under test
For this lab the system under test is a small web application deployed to Google App Engine. The application exposes basic REST-style endpoints to capture incoming HTTP POST requests (incoming data is not persisted).
Example workloads
The application that you’ll deploy is modeled after the backend service component found in many Internet-of-Things (IoT) deployments. Devices first register with the service and then begin reporting metrics or sensor readings, while also periodically re-registering with the service.
Common backend service component interaction looks like this:
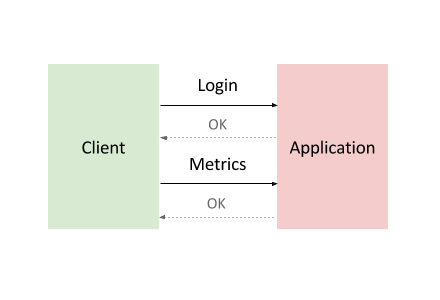
To model this interaction, you’ll use Locust, a distributed, Python-based load testing tool that is capable of distributing requests across multiple target paths. For example, Locust can distribute requests to the /login and /metrics target paths.
The workload is based on the interaction described above and is modeled as a set of Tasks in Locust. To approximate real-world clients, each Locust task is weighted. For example, registration happens once per thousand total client requests.
Container-based computing
-
The Locust container image is a Docker image that contains the Locust software.
-
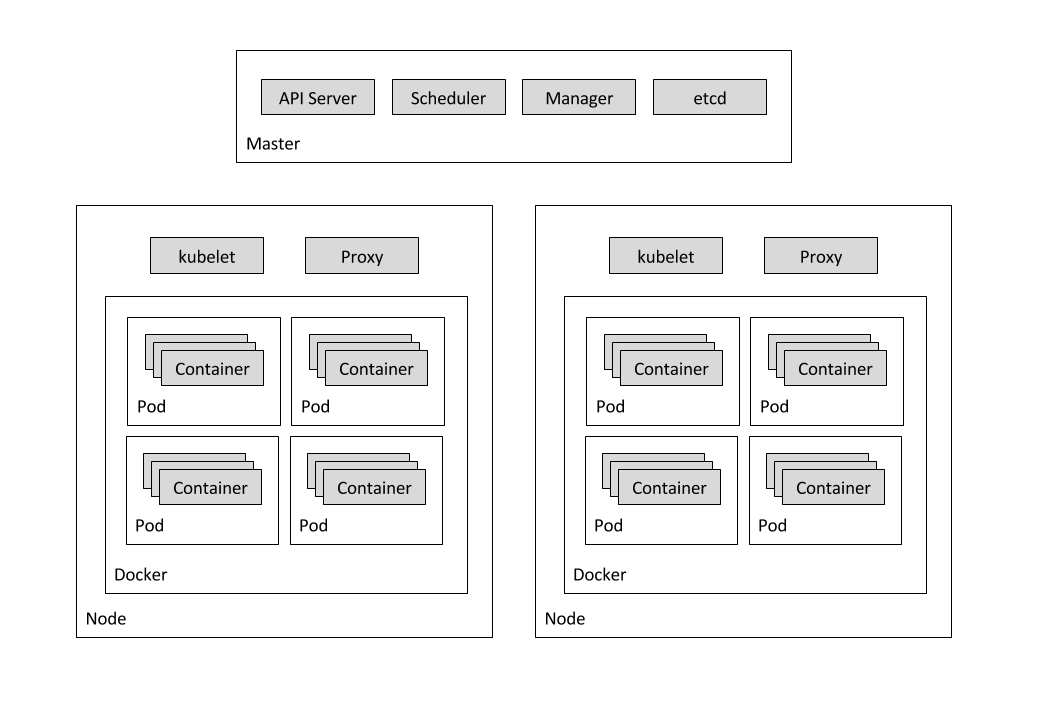
A container cluster consists of at least one cluster master and multiple worker machines called nodes. These master and node machines run the Kubernetes cluster orchestration system. For more information about clusters, see the Kubernetes Engine documentation
-
A pod is one or more containers deployed together on one host, and the smallest compute unit that can be defined, deployed, and managed. Some pods contain only a single container. For example, in this lab, each of the Locust containers runs in its own pod.
-
A Deployment controller provides declarative updates for Pods and ReplicaSets. This lab has two deployments: one for locust-master and other for locust-worker.
-
Services
A particular pod can disappear for a variety of reasons, including node failure or intentional node disruption for updates or maintenance. This means that the IP address of a pod does not provide a reliable interface for that pod. A more reliable approach would use an abstract representation of that interface that never changes, even if the underlying pod disappears and is replaced by a new pod with a different IP address. A Kubernetes Engine service provides this type of abstract interface by defining a logical set of pods and a policy for accessing them.
In this lab there are several services that represent pods or sets of pods. For example, there is a service for the DNS server pod, another service for the Locust master pod, and a service that represents all 10 Locust worker pods.
The following diagram shows the contents of the master and worker nodes:
What you’ll do
- Create a system under test i.e. a small web application deployed to Google App Engine.
- Use Kubernetes Engine to deploy a distributed load testing framework.
- Create load testing traffic for a simple REST-based API.
Prerequisites
- Familiarity with App Engine and Kubernetes Engine GCP services.
- Familiarity with standard Linux text editors such as Vim, Emacs or Nano
Set project and zone
Define environment variables for the project id, region and zone you want to use for the lab.
PROJECT=$(gcloud config get-value project)
REGION=us-central1
ZONE=${REGION}-a
CLUSTER=gke-load-test
TARGET=${PROJECT}.appspot.com
gcloud config set compute/region $REGION
gcloud config set compute/zone $ZONE
Get the sample code and build a Docker image for the application
Get the source code from the repository by running:
git clone https://github.com/GoogleCloudPlatform/distributed-load-testing-using-kubernetes.git
Move into the directory:
cd distributed-load-testing-using-kubernetes/
Build docker image and store it in container registry.
gcloud builds submit --tag gcr.io/$PROJECT/locust-tasks:latest docker-image/.
Example Output:
ID                                    CREATE_TIME                DURATION  SOURCE                                                                                                   IMAGES                                                       STATUS
47f1b8f7-0b81-492c-aa3f-19b2b32e515d  xxxxxxx  51S       gs://project_id_cloudbuild/source/1554261539.12-a7945015d56748e796c55f17b448e368.tgz  gcr.io/project_id/locust-tasks (+1 more)  SUCCESS
Deploy Web Application
The sample-webapp folder contains a simple Google App Engine Python application as the “system under test”. To deploy the application to your project use the gcloud app deploy command:
gcloud app deploy sample-webapp/app.yaml
Note: You will need the URL of the deployed sample web application when deploying the
locust-masterandlocust-workerdeployments which is already stored inTARGETvariable.
Deploy Kubernetes Cluster
First create the Google Kubernetes Engine cluster using the gcloud command shown below:
gcloud container clusters create $CLUSTER \
  --zone $ZONE \
  --num-nodes=5
Example Output:
NAME           LOCATION       MASTER_VERSION  MASTER_IP      MACHINE_TYPE   NODE_VERSION   NUM_NODES  STATUS
gke-load-test  us-central1-a  1.11.7-gke.12   34.66.156.246  n1-standard-1  1.11.7-gke.12  5          RUNNING
Load testing master
The first component of the deployment is the Locust master, which is the entry point for executing the load testing tasks described above. The Locust master is deployed with a single replica because we need only one master.
The configuration for the master deployment specifies several elements, including the ports that need to be exposed by the container (8089 for web interface, 5557 and 5558 for communicating with workers). This information is later used to configure the Locust workers.
The following snippet contains the configuration for the ports:
ports:
   - name: loc-master-web
     containerPort: 8089
     protocol: TCP
   - name: loc-master-p1
     containerPort: 5557
     protocol: TCP
   - name: loc-master-p2
     containerPort: 5558
     protocol: TCP
Deploy locust-master
Replace [TARGET_HOST] and [PROJECT_ID] in locust-master-controller.yaml and locust-worker-controller.yaml with the deployed endpoint and project-id respectively.
sed -i -e "s/\[TARGET_HOST\]/$TARGET/g" kubernetes-config/locust-master-controller.yaml
sed -i -e "s/\[TARGET_HOST\]/$TARGET/g" kubernetes-config/locust-worker-controller.yaml
sed -i -e "s/\[PROJECT_ID\]/$PROJECT/g" kubernetes-config/locust-master-controller.yaml
sed -i -e "s/\[PROJECT_ID\]/$PROJECT/g" kubernetes-config/locust-worker-controller.yaml
Deploy Locust master:
kubectl apply -f kubernetes-config/locust-master-controller.yaml
To confirm that the locust-master pod is created, run the following command:
kubectl get pods -l app=locust-master
Next, deploy the locust-master-service:
kubectl apply -f kubernetes-config/locust-master-service.yaml
This step will expose the pod with an internal DNS name (locust-master) and ports 8089, 5557, and 5558. As part of this step, the type: LoadBalancer directive in locust-master-service.yaml will tell Google Kubernetes Engine to create a Google Compute Engine forwarding-rule from a publicly avaialble IP address to the locust-master pod.
To view the newly created forwarding-rule, execute the following:
kubectl get svc locust-master
Example Output:
NAME            TYPE           CLUSTER-IP     EXTERNAL-IP      PORT(S)                                        AGE
locust-master   LoadBalancer   10.59.244.88   35.222.161.198   8089:30865/TCP,5557:30707/TCP,5558:31327/TCP   1m
Load testing workers
The next component of the deployment includes the Locust workers, which execute the load testing tasks described above. The Locust workers are deployed by a single deployment that creates multiple pods. The pods are spread out across the Kubernetes cluster. Each pod uses environment variables to control important configuration information such as the hostname of the system under test and the hostname of the Locust master.
After the Locust workers are deployed, you can return to the Locust master web interface and see that the number of slaves corresponds to the number of deployed workers.
The following snippet contains the deployment configuration for the name, labels, and number of replicas:
apiVersion: "extensions/v1beta1"
kind: "Deployment"
metadata:
  name: locust-worker
  labels:
    name: locust-worker
spec:
  replicas: 5
  selector:
    matchLabels:
      app: locust-worker
  template:
    metadata:
      labels:
        app: locust-worker
    spec:
...
Deploy locust-worker
Now deploy locust-worker-controller:
kubectl apply -f kubernetes-config/locust-worker-controller.yaml
The locust-worker-controller is set to deploy 5 locust-worker pods. To confirm they were deployed run the following:
kubectl get pods -l app=locust-worker
Scaling up the number of simulated users will require an increase in the number of Locust worker pods. To increase the number of pods deployed by the deployment, Kubernetes offers the ability to resize deployments without redeploying them.
The following command scales the pool of Locust worker pods to 20:
kubectl scale deployment/locust-worker --replicas=20
o confirm that pods have launched and are ready, get the list of locust-worker pods:
kubectl get pods -l app=locust-worker
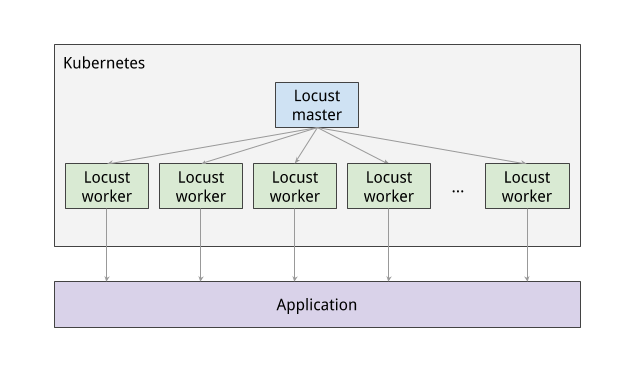
The following diagram shows the relationship between the Locust master and the Locust workers:
Execute Tests
To execute the Locust tests, get the external IP address by following command:
EXTERNAL_IP=$(kubectl get svc locust-master -o yaml | grep ip | awk -F": " '{print $NF}')
echo http://$EXTERNAL_IP:8089
Click the link and navigate to Locust master web interface.
Running Dedicated Game Servers in Google Kubernetes Engine
Packaging server applications as containers is quickly gaining traction across the tech landscape, and game companies are no exception. Many game companies are interested in using containers to improve VM utilization as well as take advantage of their isolated run-time paradigm. Despite high interest, many companies don’t know where to start.
This lab will show you how to use an expandable architecture for running a real-time, session-based multiplayer dedicated game server using Kubernetes on Google Kubernetes Engine. A scaling manager process is configured to automatically start and stop virtual machine instances as needed. Configuration of the machines as Kubernetes nodes is handled automatically by managed instance groups. The online game structure presented in this lab is intentionally simple, and places where additional complexity might be useful or necessary are pointed out where appropriate.
Objectives
- Create a container image of a popular open-source dedicated game server (DGS) on Linux using Docker. This container image adds only the binaries and necessary libraries to a base Linux image.
- Store the assets on a separate read-only persistent disk volume and mount them in the container at run-time.
- Setup and configure basic scheduler processes using the Kubernetes and Google Cloud APIs to spin up and down nodes to meet demand.
Before you begin start the download of the game client
In this lab you’ll be creating a game server, and to test the server, you need to connect to a game client. The OpenArena game client is available for many operating systems, as long as you can install it on your local machine. If you cannot install a game client on the machine you’re currently using, consider taking this lab when you are using a machine you can install a game client on. Validating your work by connecting to a game client is not required, you can choose not to. Taking this lab will still show you how to create a dedicated game server, you just won’t be able to confirm it works.
Install the OpenArena game client on your computer to test the connection to the game server at the end of the lab :
http://openarena.wikia.com/wiki/Manual/Install
This will take a while. Start working on the lab while it downloads, and check back in about 30 min to see if it’s finished. Then install the game client.
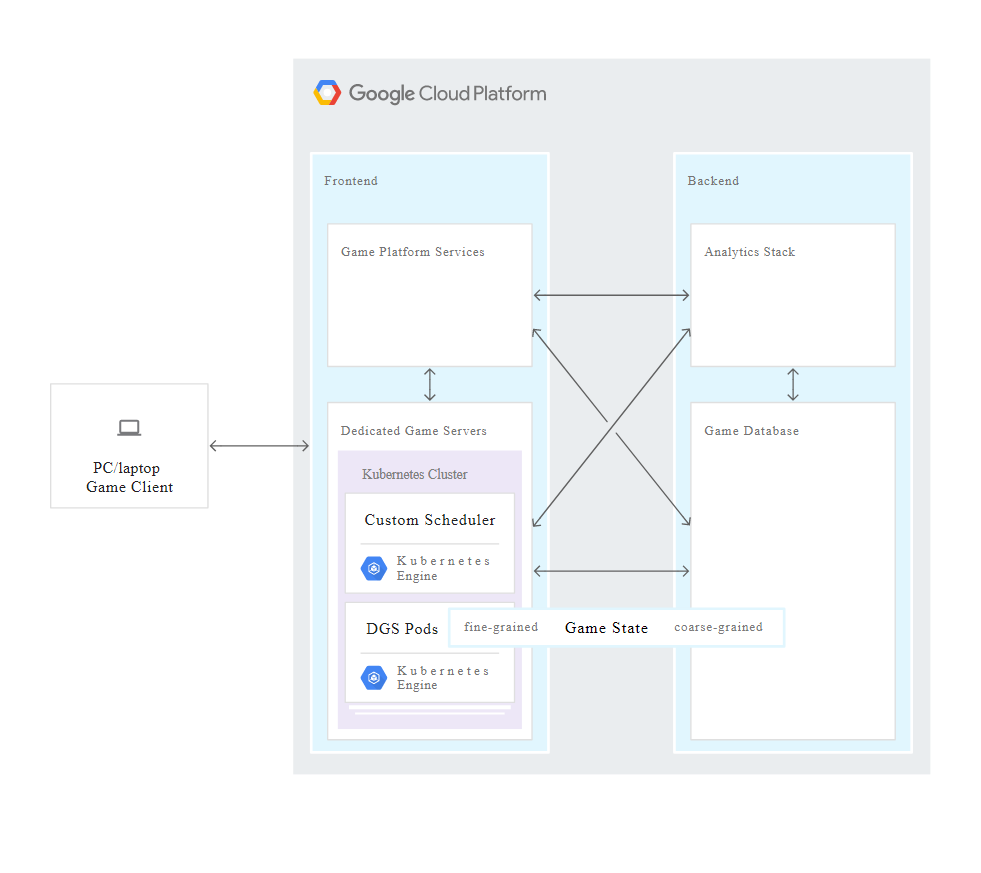
Architecture overview
The Overview of Cloud Game Infrastructure discusses the high-level components common to many online game architectures. In this lab you implement a Kubernetes DGS cluster frontend service and a scaling manager backend service. A full production game infrastructure would also include many other frontend and backend services which are outside the scope of this solution.
Constructive constraints
In an effort to produce an example that is both instructive and simple enough to extend, this lab assumes the following game constraints:
- This is a match-based real-time game with an authoritative DGS that simulates the game State.
- The DGS communicates over UDP.
- Each DGS process runs one match.
- All DGS processes generates approximately the same amount of load.
- Matches have a maximum length.
- DGS startup time is negligible, and ‘pre-warming’ of the dedicated game server process isn’t necessary.
- Customer experience impact should be avoided as much as possible:
- Once peak time has passed, matches should not be ended prematurely in order to scale down the number of VM instances.
- However, if the dedicated game server process encounters an issue and cannot continue, the match state is lost and the user is expected to join a new match.
- The DGS process loads static assets from disk but does not require write access to the assets.
- These constraints all have precedent within the game industry, and represent a real-world use case.
Note: Many of the commands in this lab require you to substitute your own values for those listed in the code. These substituted variables are capitalized and surrounded by angle brackets <>, such as
.
Containerizing the dedicated game server
In this lab, you’ll use OpenArena, a “community-produced deathmatch FPS based on GPL idTech3 technology”. Although this game’s technology is over fifteen years old, it’s still a good example of a common DGS pattern:
- A server binary is compiled from the same code base as the game client.
- The only data assets included in the server binary are those necessary for the server to run the simulation.
- The game server container image only adds the binaries and libraries necessary to run the server process to the base OS container image.
- Assets are mounted from a separate volume.
This architecture has many benefits: it speeds image distribution, reduces the update load as only binaries are replaced, and consumes less disk space.
Creating a dedicated game server binaries container image
For this lab, you cannot use Cloud Shell. You must install the GCP SDK in a client and prepare the environment so that you can create and work with docker images.
Create a VM instance to carry out lab tasks
In the Google Cloud Console Click Compute Engine > VM Instances.
Click Create Instance.
In the Identity and API access section select Allow full access to all Cloud APIs.
Click Create.
After your instance has deployed, click the SSH button. The remaining tasks for this lab will be carried out in the SSH console of this VM.
If the SSH console does not automatically open check the upper right of your browser window for a pop-up alert icon.
Click the pop-up alert icon, select Always allow pop-ups from https://console.cloud.google.com and then click Done.
Click the SSH button again to open the console.
Install kubectl and docker on your VM
Update the apt-get repositories in the VM:
sudo apt-get update
Install gcloud tools for Kubernetes:
sudo apt-get -y install kubectl
Install dependencies for docker:
sudo apt-get -y install \
     apt-transport-https \
     ca-certificates \
     curl \
     gnupg2 \
     software-properties-common
Install Docker’s official GPG key:
curl -fsSL https://download.docker.com/linux/$(. /etc/os-release; echo "$ID")/gpg | sudo apt-key add -
Check that the GPG fingerprint of the Docker key you downloaded matches the expected value:
sudo apt-key fingerprint 0EBFCD88
You should see the following fingerprint in the output
pub   4096R/0EBFCD88 2017-02-22
      Key fingerprint = 9DC8 5822 9FC7 DD38 854A  E2D8 8D81 803C 0EBF CD88
uid                  Docker Release (CE deb) <docker@docker.com>
sub   4096R/F273FCD8 2017-02-22
Add the stable Docker repository:
sudo add-apt-repository "deb [arch=amd64] https://download.docker.com/linux/$(. /etc/os-release; echo "$ID") $(lsb_release -cs) stable"
Update the apt-get repositories:
sudo apt-get update
Install Docker-ce:
sudo apt-get -y install docker-ce
Configure Docker to run as a non-root user:
sudo usermod -aG docker $USER
Exit from the SSH session then reconnect by clicking the SSH button for your VM instance.
You have to disconnect and reconnect the SSH session because the group permission change does not take effect until the user logs in again.
Confirm that you can run Docker as a non-root user:
docker run hello-world
You should see the following message in the output.
Hello from Docker!
This message shows that your installation appears to be working correctly.
Download the Sample Game Server Demo
Clone the demo example:
git clone https://github.com/GoogleCloudPlatform/gke-dedicated-game-server.git
Creating a dedicated game server binaries container image
Prepare the working environment Select the gcr.io region nearest to your Kubernetes Engine cluster (for example, us for the United States, eu for Europe, or asia for Asia, as noted in the documentation).
Substitute your <PROJECT_ID> and your gcr.io region for <GCR_REGION> in this command:
export GCR_REGION=<REGION> PROJECT_ID=<PROJECT_ID>
printf "$GCR_REGION \n$PROJECT_ID\n"
The updated command will look something like:
export GCR_REGION=us PROJECT_ID=qwiklabs-gcp-6bcf12ce01eb3dc7
printf "$GCR_REGION \n$PROJECT_ID\n"
Generate a new container image
You first create a Dockerfile describing the image to be built. This lab’s Debian-based Dockerfile is in the repository at openarena/Dockerfile.
cd gke-dedicated-game-server/openarena
Run this Docker build command to generate the container image and tag it. For ease of use with Google Kubernetes Engine, we’re using Google Container Registry ( gcr.io ).
docker build -t \
${GCR_REGION}.gcr.io/${PROJECT_ID}/openarena:0.8.8 .
You may see some warnings and errors during the build but if the command completes with two statements starting with Successfully built and Successfully tagged then you can proceed.
Upload the container image to an image repository:
gcloud docker -- push \
  ${GCR_REGION}.gcr.io/${PROJECT_ID}/openarena:0.8.8
Generate an assets disk
In most games binaries are orders of magnitude smaller than assets. Because of this fact, it makes sense to create a container image that only contains binaries; assets can be put on a persistent disk and attached to multiple VM instances that run the DGS container. This architecture saves money and eliminates the need to distribute assets to all VM instances.
Create an OpenArena asset disk by following these steps:
Set the default region and store a zone ID in an environment variable:
region=us-east1
zone_1=${region}-b
gcloud config set compute/region ${region}
Create a small Compute Engine VM instance using gcloud.
gcloud compute instances create openarena-asset-builder \
   --machine-type f1-micro \
   --image-family debian-9 \
   --image-project debian-cloud \
   --zone ${zone_1}
Create and attach an appropriately-sized persistent disk. The persistent disk must be separate from the boot disk, and should be configured to remain undeleted when the virtual machine is removed. Kubernetes persistentVolume functionality works best with persistent disks initialized according to the Compute Engine documentation consisting of a single ext4 file system without a partition table.
gcloud compute disks create openarena-assets \
   --size=50GB --type=pd-ssd\
   --description="OpenArena data disk. Mount read-only at
/usr/share/games/openarena/baseoa/" \
   --zone ${zone_1}
Note: Some persistent disk types have more performance when provisioned at larger disk sizes. Please consult the documentation when choosing your disk size. Depending on how read-heavy your engine is, it might make sense to choose a disk larger than needed to hold the data in order to have additional performance.
Wait until the openarena-asset-builder instance has fully started up, then attach the persistent disk.
gcloud compute instances attach-disk openarena-asset-builder \
   --disk openarena-assets --zone ${zone_1}
Once attached, you can SSH into the openarena-asset-builder VM instance and format the new persistent disk.
Connect to the Asset Builder VM Instance using SSH
In the Console, click Compute Engine > VM Instances.
Click the SSH button next to the openarena-asset-builder instance.
This will open a new SSH console that you will use to prepare the persistent volume.
Format and Configure the Assets Disk
New disks are unformatted. You must format and mount a disk before it can be used. First, attach the openarena-assets persistent disk to the openarena-asset-builder VM instance.
Because the mkfs.ext4 command in the next step is a destructive command, confirm the device ID for the openarena-assets disk. If you’re following this lab from the beginning, the ID is /dev/sdb.
Verify this using the lsblk command to look at the attached disks and their partitions:
sudo lsblk
The output should show the 10 GB OS disk sda with 1 partition sda1 and the 50 GB openarena-assets disk with no partition as device sdb:
NAME MAJ:MIN RM SIZE RO TYPE MOUNTPOINT
sda      8:0  0  10G  0 disk
└─sda1   8:1  0  10G  0 part /
sdb      8:16 0  50G  0 disk
Note: If you only see sda and sda1 in this list, check that you are running these commands in the SSH console for the openarena-assets-builder VM instance.
Format the openarena-assets disk:
sudo mkfs.ext4 -m 0 -F -E lazy_itable_init=0,lazy_journal_init=0,discard /dev/sdb
Install OpenArena on the openarena-asset-builder VM instance and copy the compressed asset archives to the openarena-assets persistent disk. For this game, the assets are .pk3 files, located in the /usr/share/games/openarena/baseoa/ directory.
To save some work, mount the assets disk to this directory before installing, so all the .pk3 files get put on the disk by the install process:
sudo mkdir -p /usr/share/games/openarena/baseoa/

sudo mount -o discard,defaults /dev/sdb \
    /usr/share/games/openarena/baseoa/
sudo apt-get update
sudo apt-get -y install openarena-server

sudo gsutil cp gs://qwiklabs-assets/single-match.cfg /usr/share/games/openarena/baseoa/single-match.cfg
Once the installation has been completed unmount the persistent volume and shut down the instance:
sudo umount -f -l /usr/share/games/openarena/baseoa/
sudo shutdown -h now
The SSH console will now stop responding, this is expected.
The persistent disk is ready to be used as a persistentVolume in Kubernetes and the instance can be safely deleted.
Return to your main lab VM instance SSH console and verify value of zone_1 variable which you set earlier
echo $zone_1
Expected output:
us-east1-b
If it is not set, i.e. it returns none, you can set it via following command:
region=us-east1
zone_1=${region}-b
Now, delete the openarena-asset-builder VM.
gcloud compute instances delete openarena-asset-builder --zone ${zone_1}
Enter Y when prompted to confirm the deletion.
When implementing persistent disks as part of a game development pipeline, configure your build system to create the persistent disk with all the asset files in an appropriate directory structure. This may take the form of a simple script running gcloud commands, or a GCP-specific plugin for your build system of choice. It’s also recommended that you create multiple copies of the persistent disk and have VM instances connected to these copies in a balanced manner both for throughput considerations and to manage failure risk.
Setting up a Kubernetes cluster
Creating a Kubernetes cluster on Container Engine For this lab you’re using a standard Container Engine cluster with the n1-standard machine type, which fine for demonstration purposes. In a production environment, the n1-highcpu machine types are more appropriate for the usage profile of OpenArena. The number of vCPUs you’ll run on each machine is largely influenced by two factors:
- The largest number of concurrent DGS pods you plan to run:
- There is a limit on the number of nodes that can be in a Kubernetes cluster pool (although the Kubernetes project plans to increase this with future releases). For example, If you run one DGS per Virtual CPU (vCPU), a 1,000 node cluster of n1-highcpu-2 machines provides capacity for only 2,000 DGS pods, while a 1,000 node cluster of n1-highcpu-32 machines allows up to 32,000.
- Your VM instance granularity:
- The simplest way for resources to be added or removed from the cluster is in increments of a single VM instance of the type chosen during cluster creation.
For this lab the number of vCPUs is limited to 2 per node as that is sufficient.
In Cloud Shell create a network and firewall rules for the gaming cluster.
gcloud compute networks create game
gcloud compute firewall-rules create openarena-dgs --network game \
    --allow udp:27961-28061
Use SSH console for the main VM instance which you created earlier to run next commands.
The following gcloud create command creates a three-node cluster ( –numnodes 3 ) with four virtual CPU cores on each ( –machine-type=n1-standard-2 ):
gcloud container clusters create openarena-cluster \
   --num-nodes 3 \
   --network game \
   --machine-type=n1-standard-2 \
   --zone=${zone_1}
It may take up to 10 minutes for the cluster to start up.
Once the cluster has started, set up your local shell with the proper Kubernetes authentication credentials to control your new cluster
gcloud container clusters get-credentials openarena-cluster --zone ${zone_1}
Although the managed instance groups feature used by Container Engine offers VM instance autoscaling to increase and decrease the number of nodes in the pool based on usage, the previous command disabled this feature using the --disable-addons=HttpLoadBalancing,HorizontalPodAutoscaling flag.
Many game developers find it useful to implement a custom scaling manager process which is DGS aware to deal with the specific requirements of this type of workload. The managed instance group does serve an important function: its default Container Engine image template includes all the necessary Kubernetes software and automatically registers the node with the master on startup.
In addition, you disabled HTTP Load Balancing with the –disable-addons flag. The pods running in this cluster don’t require it.
Configuring the assets disk in Kubernetes
The typical DGS does not need write access to the game assets, so you can have each DGS pod mount the same persistent disk containing read-only assets. To accomplish this, first create the assets disk as described in the Generate an assets disk section, which you’ve already done. Next, create a PersistentVolume in Kubernetes.
In order to include this volume in a Kubernetes DGS pod, you need a PersistentVolumeClaim resource. YAML files for these resources are found in the openarena/k8s/ directory of the solution repository. Once applied, the PersistentVolume detects the asset disk, and the persistentVolumeClaim allows a DGS pod to mount the disk as read-only.
Run the following commands to create the PersistentVolume and the PersistentVolumeClaim:
kubectl apply -f k8s/asset-volume.yaml
kubectl apply -f k8s/asset-volumeclaim.yaml
Note: If you experience connection issues running the kubectl commands, make sure you have kubectl set up correctly, and that you’ve acquired the proper credentials for the new openarena-cluster.
If these commands produce an error saying that the path does not exist, double check the directory you are running the commands from. These commands must be run from the
~/gke-dedicated-game-server/openarena directory.
You can confirm both volume and claim are in Bound status by running the following commands and comparing the output:
kubectl get persistentVolume
Expected output:
NAME         CAPACITY ACCESSMODES RECLAIMPOLICY STATUS CLAIM   STORAGECLASS      REASON AGE
asset.volume 50Gi     ROX         Retain        Bound  default /asset.disk.claim assets 3m
Then run:
kubectl get persistentVolumeClaim
Expected output:
NAME             STATUS VOLUME       CAPACITY ACCESSMODES STORAGECLASS AGE
asset.disk.claim Bound  asset.volume 50Gi     ROX         assets 2     5s
Configuring the DGS pod
Since scheduling and networking tasks are handled by Kubernetes, and the startup and shutdown time of the DGS containers are relatively negligible, this solution has DGS instances spin up on-demand.
Each DGS instance only lasts the length of a single game match. In addition, it’s implied that each game match has a defined time limit, specified in the OpenArena DGS server configuration file. Once the match is complete, the container successfully exits and if players want to play again they simply request another game.These assumptions simplify a number of pod lifecycle aspects and form the basis of an autoscaling policy discussed in the scaling manager section.
Although this flow isn’t seamless with OpenArena, it’s only because the solution doesn’t fork and change the game client code. In a commercially released game, requesting another match would be made invisible to the user behind previous match result screens and loading times. The code requiring the server change doesn’t represent additional development time as such code is mandatory for handling client reconnections during unforeseen circumstances such as network issues or crashing servers.
For the sake of simplicity, this solution for this lab assumes that the Container Engine nodes have the default network configuration, which assigns each a public IP and allows clients connections.
Managing the dedicated game server process
In commercially produced game servers, all the additional, non-DGS functionality that makes DGSes run as well as containers should be integrated directly into the DGS binaries whenever possible.
As a best practice, the DGS should avoid communicating directly with the matchmaker or scaling manager whenever possible, and instead should expose its state to the Kubernetes API. External processes should read the DGS state from the appropriate Kubernetes endpoints rather than querying the server directly. More information on accessing the Kubernetes API directly can be found here.
Kubernetes resource definitions At first glance, a single process running in a container with a constrained lifetime and defined success criteria would appear to be a use case for Kubernetes jobs, but in practice it’s unnecessary. DGS pods require neither the parallel execution functionality of jobs, nor the ability to guarantee successes by automatically restarting (typically when a session-based DGS dies for some reason, the state is lost, and players simply join another DGS). Due to these factors, scheduling individual Kubernetes pods is preferable for this use case.
In production, DGS pods should be started directly by your matchmaker using the Kubernetes API. For the purposes of this lab, a human-readable YAML file describing the DGS pod resource is included in the solution repository at openarena/k8s/oarena_pod.yaml. When creating configurations for dedicated game server pods, pay close attention to the volume properties to ensure that the asset disk can be mounted as read-only in multiple pods.
Setting up the scaling manager
Note: These commands are run from the repository’s scaling_manager/ directory but assume that you start in the repositories openarena/ directory.
The scaling manager is a simple process that scales the number of virtual machines used as Container Engine nodes based on the current DGS load. In practice, scaling is accomplished using a set of simple scripts that run forever, inspect the total number of DGS pods running and requested, and resize the node pool as necessary. The scripts are packaged in docker container images with the appropriate libraries and Google Cloud SDK.
The docker files creating these images are in the lab’s repository in the scaling_manager/ directory, and the docker image can be created and pushed to gcr.io using the build and push shell script once a number of environment variables are configured.
Build and push the configuration using the following command:
cd ../scaling-manager
./build-and-push.sh
These scripts are designed to be be run within a kubernetes deployment , ensuring these processes are restarted in the event of a failure.
Configure the Openarena Scaling Manager Deployment File
An example kubernetes deployment YAML file is provided in the sample solution in the scaling_manager/k8s/openarena-scaling-manager-deployment.yaml directory. This file has to be customized so that the container environment variables it configures use values that describe your lab’s OpenArena cluster.
Find the name of the base instance:
gcloud compute instance-groups managed list
Copy the base instance name. It will be in the fourth column of the output which will look similar to this:
BASE_INSTANCE_NAME
gke-openarena-cluster-default-pool-1990bcc7
In this next series of commands, replace all of the items in square brackets, including the square brackets themselves, with the appropriate values from your lab. For example, you might replace [GCR_REGION] with “us” and [ZONE] with “us-east1-b”. Both [PROJECT_ID] and [BASE_INSTANCE_ID] will vary for each lab instance:
export GCR_REGION=[GCR_REGION]

export PROJECT_ID=[PROJECT_ID]

export GKE_BASE_INSTANCE_NAME=[BASE_INSTANCE_NAME]

export GCP_ZONE=[ZONE]

printf "$GCR_REGION \n$PROJECT_ID \n$GKE_BASE_INSTANCE_NAME \n$GCP_ZONE \n"
export GCR_REGION=us

export PROJECT_ID=qwiklabs-gcp-6bcf12ce01eb3dc7

export GKE_BASE_INSTANCE_NAME=gke-openarena-cluster-default-pool-08e2eb0b

export GCP_ZONE=us-east1-b

printf "$GCR_REGION \n$PROJECT_ID \n$GKE_BASE_INSTANCE_NAME \n$GCP_ZONE \n"
Now run the following to apply the variables you set to the YAML deployment template:
sed -i "s/\[GCR_REGION\]/$GCR_REGION/g" k8s/openarena-scaling-manager-deployment.yaml

sed -i "s/\[PROJECT_ID\]/$PROJECT_ID/g" k8s/openarena-scaling-manager-deployment.yaml

sed -i "s/\[ZONE\]/$GCP_ZONE/g" k8s/openarena-scaling-manager-deployment.yaml

sed -i "s/\gke-openarena-cluster-default-pool-\[REPLACE_ME\]/$GKE_BASE_INSTANCE_NAME/g" k8s/openarena-scaling-manager-deployment.yaml
These commands update the placeholders in the file for the environment variable values listed below with the correct values.
| Replacement text | Value | Notes |
|---|---|---|
| [GCR_REGION] | gcr.io region such as us, asia, etc. | Requires replacement. The region of your gcr.io repository. |
| [PROJECT_ID] | Qwiklabs Project ID, you can copy this from your lab launch page. | Requires replacement. The name of your project. |
| [REPLACE_ME] | This is the value you identified in the previous step. You just replace the 8 digit unique id at the end. | gke-openarena-cluster-default-pool-[REPLACE_ME]. Requires replacement. Different for every ContainerEngine cluster. The value can be obtained from the output of the gcloud compute instance-groups managed list command. |
| [ZONE] | Set this to the GCP Zone you selected at that start of the lab. This is usually us-east1-b. | The name of the GCP zone specified in the gcloud container clusters create command. |
The following environment variable values should remain at their defaults.
| Replacement text | Value | Notes |
|---|---|---|
| K8S_CLUSTER | openarena-cluster | The name of the Kubernetes cluster. |
You can now add the deployment to your Kubernetes cluster by running:
kubectl apply -f k8s/openarena-scaling-manager-deployment.yaml
Monitor the deployment using kubectl.
kubectl get pods
Wait until you see this report 3/3 nodes ready.
Scaling nodes
Concerns
To scale nodes, the scaling manager uses the Kubernetes API to look at current node usage and, as needed, resizes the Container Engine cluster’s managed instance group running the underlying virtual machines. Common sticking points for DGS scaling include:
- Standard CPU and memory usage metrics often fail to capture enough information to drive game server instance scaling.
- Keeping a buffer of available, underutilized nodes is critical, as scheduling an optimized DGS container on an existing node takes a matter of seconds, whereas adding a new node can take minutes - an unacceptable latency for a waiting player.
- Many autoscalers aren’t able to handle graceful pod shutdowns. It’s important to drain pods from nodes being removed due to scaling. Shutting off a node with even one running match is often unacceptable.
Although the scripts supplied by this solution are basic, their simple design makes it easy to add additional logic. Typical DGSes have well-understood performance characteristics, and by making these into metrics you can determine when to add or remove VM instances. Common scaling metrics are number of DGS instances per CPU, as used in this solution, or available player slots.
Scaling up For this solution, scaling up requires no special handling; simply increasing the number of nodes in the managed instance group is sufficient. For simplicity, this solution uses the limits and requests pod properties in Kubernetes to ‘reserve’ approximately one vCPU and 500MB of memory for each DGS. Since you created the cluster using the n1-highcpu instance family, which has a fixed ratio of 600MB of memory to 1 vCPU, you can safely assume there will be sufficient memory if you schedule one DGS pod per vCPU. Because of this fact, you can scale based on the number of pods in the cluster compared to the number of CPUs in all nodes in the cluster. This ratio determines the remaining resources available, allowing you to add more nodes if the value falls below a threshold. This solution adds nodes if more than 70% of the vCPUs are currently allocated to pods.
In a live, production online game backend, it is recommended that you accurately profile DGS CPU, memory, and network usage and chose your limits and requests pod properties appropriately. For many games, it makes sense to create multiple pod types for different DGS scenarios with different usage profiles, such as game types, specific maps, or number of player slots. Such considerations falls outside the scope of this solution.
Scaling down Scaling down, unlike scaling up, is a multi-step process and one of the major reasons to run a custom, Kubernetes-aware, DGS scaling manager. In this lab, scaling_manger.sh handles the following steps:
- An appropriate node must be selected for removal. Since a full custom game-aware Kubernetes scheduler is outside the scope of this lab, the nodes are selected in the order they are returned by the API.
- The selected node is marked as ‘unschedulable’ in Kubernetes by using the cordon command. This prevents additional pods from being started on this node.
- The selected node is removed from the managed instance group using the abandon-instance command. This prevents the managed instance group from attempting to recreate the instance. Separately, the node_stopper.sh script monitors abandoned, unschedulable nodes for the absence of DGS pods. Once all matches on a node have finished and the pods successfully exit, the script shuts down the VM instance.
Scaling the number of DGS pods In typical production game backends, the matchmaker controls when new DGS instances are added. Since DGS pods are configured to successfully exit when matches complete (refer to the constraints ), no explicit action is necessary to scale down the number of DGS pods. If there are not enough player requests coming into the matchmaker system to generate new matches, the DGS pods will slowly remove themselves from the Kubernetes cluster as matches end, in effect scaling down the number of pods.
Testing the setup
So far, the OpenArena container image has been created and pushed to the container registry, and the DGS Kubernetes cluster has been started. In addition, the game asset disk has been generated and configured for use in Kubernetes, and the scaling manager deployment has been started. Now it’s time to start DGS pods for testing.
Requesting a new DGS instance
In a typical production system, the matchmaker process would directly request an instance using the Kubernetes API when it has appropriate players for a match. For the purposes of testing this solution’s setup, the request for an instance can be made using a simple kubectl command, specifying the openarena_pod.yaml file.
You must first update the file openarena/k8s/openarena-pod.yaml file and replace [GCR_REGION] and [PROJECT_ID] in the containers - image: value. Since the variables are already defined, we can use sed again to do this:
cd ..
sed -i "s/\[GCR_REGION\]/$GCR_REGION/g" openarena/k8s/openarena-pod.yaml
sed -i "s/\[PROJECT_ID\]/$PROJECT_ID/g" openarena/k8s/openarena-pod.yaml
Try this only if the pod errors out at launch.
sed -i "s/\/usr\/share\/games\/openarena\/baseoa/\/usr\/lib\/openarena-server\/baseoa/g" openarena/k8s/openarena-pod.yaml
Apply the new pod configuration by running:
kubectl apply -f openarena/k8s/openarena-pod.yaml
A few seconds later, the status of the pod can be confirmed using kubectl:
kubectl get pods
Repeat the kubectl get pods command until you get the following output:
NAME          READY STATUS  RESTARTS AGE
openarena.dgs 1/1   Running 0        25s
Connecting to the DGS
After the pod has started, the following commands will identify the game server ip address that you can use to connect to the game instance on port 27461.
export NODE_NAME=$(kubectl get pod openarena.dgs \
    -o jsonpath="{.spec.nodeName}")
export DGS_IP=$(gcloud compute instances list \
    --filter="name=( ${NODE_NAME} )" \
    --format='table[no-heading](EXTERNAL_IP)')

printf "Node Name: $NODE_NAME \nNode IP  : $DGS_IP \nPort         : 27961\n"
printf " launch client with: \nopenarena +connect $DGS_IP +set net_port 27961\n"
Launch the OpenArena client on your own computer once the game has been installed.
Select Multiplayer and then Specify.
Configure the server ip-address and port using those listed by the output of the last command.
Click Connect.
Note: The configuration settings for this solution limit the game server duration to a few minutes, so don’t wait too long before testing the client connection or you might have to start another pod.
Close the OpenArena client.
Testing the scaling manager Since the scaling manager scales the number of VM instances in the Kubernetes cluster based on the number of DGS pods, testing it requires requesting a number of pods over a period of time and checking that the number of nodes scale appropriately.
For testing purposes, a script is provided in the solutions repository which adds four DGS pods per minute for 5 minutes:
./scaling-manager/tests/test-loader.sh
In your own environment, make sure to set the match length in the server configuration file to an appropriate limit so that the pods eventually exit and you can see the nodes scale back down! For this lab, the server configuration file places a five minute time limit on the match, and can be used as an example. It’s located in the repo at openarena/single-match.cfg, and is used by default.
Open the Google Cloud Platform Console and click Kubernetes Engine, then click Workloads.
You will see a sequence of workloads startup called openarena-dgs.s, openarena-dgs.2 up to openarena-dgs.15. Because there are a limited the number of vCPUs in this cluster, many of the test containers will initially show an error state with a status of “Unschedulable”. As the startup load in each container reduces, some of the later game server containers will successfully start up. All containers will start after about 10 minutes.
If you explore any of the failed instances you will see that the reason for the failure is a lack of CPU resources. If you explore any of the running instances you will see that the game server has initialized on those instances.
Awwvision: Cloud Vision API from a Kubernetes Cluster
Overview
The Awwvision lab uses Kubernetes and Cloud Vision API to demonstrate how to use the Vision API to classify (label) images from Reddit’s /r/aww subreddit and display the labelled results in a web app.
Awwvision has three components:
- A simple Redis instance.
- A web app that displays the labels and associated images.
- A worker that handles scraping Reddit for images and classifying them using the Vision API. Cloud Pub/Sub is used to coordinate tasks between multiple worker instances.
Create a Kubernetes Engine cluster
In this lab you will use gcloud, Google Cloud Platform’s command-line tool, to set up a Kubernetes Engine cluster. You can specify as many nodes as you want, but you need at least one. The cloud platform scope is used to allow access to the Pub/Sub and Vision APIs.
In Cloud Shell, run the following to create a cluster in the us-central1-f zone:
gcloud config set compute/zone us-central1-f
Then start up the cluster by running:
gcloud container clusters create awwvision \
    --num-nodes 2 \
    --scopes cloud-platform
Run the following to use the container’s credentials:
gcloud container clusters get-credentials awwvision
Verify that everything is working using the kubectl command-line tool:
kubectl cluster-info
Get the Sample
Now add sample data to your project by running:
git clone https://github.com/GoogleCloudPlatform/cloud-vision
Deploy the sample
In Cloud Shell, change to the python/awwvision directory in the cloned cloud-vision repo:
cd cloud-vision/python/awwvision
Once in the awwvision directory, run make all to build and deploy everything:
make all
As part of the process, Docker images will be built and uploaded to the Google Container Registry private container registry. In addition, yaml files will be generated from templates, filled in with information specific to your project, and used to deploy the redis, webapp, and worker Kubernetes resources for the lab.
Check the Kubernetes resources on the cluster
After you’ve deployed, check that the Kubernetes resources are up and running.
First, list the pods by running:
kubectl get pods
You should see something like the following, though your pod names will be different. Make sure all of your pods have a Running before executing the next command.
NAME                     READY     STATUS    RESTARTS   AGE
awwvision-webapp-vwmr1   1/1       Running   0          1m
awwvision-worker-oz6xn   1/1       Running   0          1m
awwvision-worker-qc0b0   1/1       Running   0          1m
awwvision-worker-xpe53   1/1       Running   0          1m
redis-master-rpap8       1/1       Running   0          2m
Next, list the deployments by running:
kubectl get deployments -o wide
You can see the number of replicas specified for each, and the images used.
NAME               DESIRED   CURRENT   UP-TO-DATE   AVAILABLE   AGE       CONTAINERS         IMAGES                                SELECTOR
awwvision-webapp   1         1         1            1           1m        awwvision-webapp   gcr.io/your-project/awwvision-webapp   app=awwvision,role=frontend
awwvision-worker   3         3         3            3           1m        awwvision-worker   gcr.io/your-project/awwvision-worker   app=awwvision,role=worker
redis-master       1         1         1            1           1m        redis-master       redis                                 app=redis,role=master
Once deployed, get the external IP address of the webapp service by running:
kubectl get svc awwvision-webapp
It may take a few minutes for the assigned external IP to be listed in the output. You should see something like the following, though your IPs will be different.
NAME               CLUSTER_IP      EXTERNAL_IP    PORT(S)   SELECTOR                      AGE
awwvision-webapp   10.163.250.49   23.236.61.91   80/TCP    app=awwvision,role=frontend   13m
Visit your new web app and start its crawler
Copy and paste the external IP of the awwvision-webapp service into a new browser to open the webapp, then click Start the Crawler button.
Next, click go back and you should start to see images from the /r/aww subreddit classified by the labels provided by the Vision API. You will see some of the images classified multiple times, when multiple labels are detected for them. (You can reload in a bit, in case you brought up the page before the crawler was finished).
Running a MongoDB Database in Kubernetes with StatefulSets
Overview
Kubernetes is an open source container orchestration tool that handles the complexities of running containerized applications. You can run Kubernetes applications with Kubernetes Engine—a GCP computing service that offers many different customizations and integrations. In this lab, you will get some practical experience with Kubernetes by learning how to set up a MongoDB database with a StatefulSet. Running a stateful application (a database) on a stateless service (container) may sound contradictory. However, after getting hands-on practice with this lab you will quickly see how that’s not the case. In fact, by using a few open-source tools you will see how Kubernetes and stateless services can go hand-in-hand.
What you’ll learn In this lab, you will learn the following:
- How to deploy a Kubernetes cluster, a headless service, and a StatefulSet.
- How to connect a Kubernetes cluster to a MongoDB replica set.
- How to scale MongoDB replica set instances up and down.
- How to clean up your environment and shutdown the above services.
Set a Compute Zone
Throughout this lab, we will be using the gcloud command line tool to provision our services. Before we can create our Kubernetes cluster, we will need to set a compute zone so that the virtual machines in our cluster are all created in the same region. We can do this using the gcloud config set command—run the following in your cloud shell to set your zone to us-central1-f:
gcloud config set compute/zone us-central1-f
? Note: More information about regions and zones is available here.
Create a new Cluster
Now that our zone is set, we will create a new cluster of containers. Run the following command to instantiate a cluster named hello-world:
gcloud container clusters create hello-world
This command creates a new cluster with three nodes, or virtual machines (the default). You can configure this command with additional flags to change the number of nodes, the default permissions, and other variables. See the documentation for more details.
Launching the cluster may take a few minutes. Once it’s up, you should receive a similar output:
NAME         Location       MATER_VERSION   MASTER_IP       ...
hello-world  us-central1-f  1.9.7-gke.3     35.184.131.251  ...
Setting up
Now that we have our cluster up and running, it’s time to integrate it with MongoDB. We will be using a replica set so that our data is highly available and redundant—a must for running production applications. To get set up, we need to do the following:
- Download the MongoDB replica set/sidecar (or utility container in our cluster).
- Instantiate a StorageClass.
- Instantiate a headless service.
- Instantiate a StatefulSet. Run the following command to clone the MongoDB/Kubernetes replica set from the Github repository:
git clone https://github.com/thesandlord/mongo-k8s-sidecar.git
Once it’s cloned, navigate to the StatefulSet directory with the following command:
cd ./mongo-k8s-sidecar/example/StatefulSet/
Once you have verified that the files have been downloaded and that you’re in the right directory, let’s go ahead and create a Kubernetes StorageClass.
Create the StorageClass
A StorageClass tells Kubernetes what kind of storage you want to use for database nodes. On the Google Cloud Platform, you have a couple of storage choices: SSDs and hard disks.
If you take a look inside the StatefulSet directory (you can do this by running the ls command), you will see SSD and HDD configuration files for both Azure and GCP. Run the following command to take a look at the googlecloud_ssd.yaml file:
cat googlecloud_ssd.yaml
Output:
kind: StorageClass
apiVersion: storage.k8s.io/v1beta1
metadata:
  name: fast
provisioner: kubernetes.io/gce-pd
parameters:
  type: pd-ssd
This configuration creates a new StorageClass called “fast” that is backed by SSD volumes. Run the following command to deploy the StorageClass:
kubectl apply -f googlecloud_ssd.yaml
Now that our StorageClass is configured, our StatefulSet can now request a volume that will automatically be created.
Deploying the Headless Service and StatefulSet
Find and inspect the files
Before we dive into what headless service and StatefulSets are, let’s open up the configuration file (mongo-statefulset.yaml) where they are both housed in.
cat mongo-statefulset.yaml
You should receive the following output (without the pointers to the Headless Service and StatefulSet content):
apiVersion: v1   <-----------   Headless Service configuration
kind: Service
metadata:
  name: mongo
  labels:
    name: mongo
spec:
  ports:
  - port: 27017
    targetPort: 27017
  clusterIP: None
  selector:
    role: mongo
---
apiVersion: apps/v1beta1    <------- StatefulSet configuration
kind: StatefulSet
metadata:
  name: mongo
spec:
  serviceName: "mongo"
  replicas: 3
  template:
    metadata:
      labels:
        role: mongo
        environment: test
    spec:
      terminationGracePeriodSeconds: 10
      containers:
        - name: mongo
          image: mongo
          command:
            - mongod
            - "--replSet"
            - rs0
            - "--smallfiles"
            - "--noprealloc"
          ports:
            - containerPort: 27017
          volumeMounts:
            - name: mongo-persistent-storage
              mountPath: /data/db
        - name: mongo-sidecar
          image: cvallance/mongo-k8s-sidecar
          env:
            - name: MONGO_SIDECAR_POD_LABELS
              value: "role=mongo,environment=test"
  volumeClaimTemplates:
  - metadata:
      name: mongo-persistent-storage
      annotations:
        volume.beta.kubernetes.io/storage-class: "fast"
    spec:
      accessModes: [ "ReadWriteOnce" ]
      resources:
        requests:
          storage: 100Gi
Headless service: overview The first section of mongo-statefulset.yaml refers to a headless service. In Kubernetes terms, a service describes policies or rules for accessing specific pods. In brief, a headless service is one that doesn’t prescribe load balancing. When combined with StatefulSets, this will give us individual DNSs to access our pods, and in turn a way to connect to all of our MongoDB nodes individually. In the yaml file, you can make sure that the service is headless by verifying that the clusterIP field is set to None.
StatefulSet: overview The StatefulSet configuration is the second section of mongo-statefulset.yaml. This is the bread and butter of the application: it’s the workload that runs MongoDB and what orchestrates your Kubernetes resources. Referencing the yaml file, we see that the first section describes the StatefulSet object. Then, we move into the Metadata section, where labels and the number of replicas are specified.
Next comes the pod spec. The terminationGracePeriodSeconds is used to gracefully shutdown the pod when you scale down the number of replicas. Then the configurations for the two containers are shown. The first one runs MongoDB with command line flags that configure the replica set name. It also mounts the persistent storage volume to /data/db: the location where MongoDB saves its data. The second container runs the sidecar. This sidecar container will configure the MongoDB replica set automatically. As mentioned earlier, a “sidecar” is a helper container that helps the main container run its jobs and tasks.
Finally, there is the volumeClaimTemplates. This is what talks to the StorageClass we created before to provision the volume. It provisions a 100 GB disk for each MongoDB replica.
Deploy Headless Service and the StatefulSet Now that we have a basic understanding of what a headless service and StatefulSet are, let’s go ahead and deploy them. Since the two are packaged in mongo-statefulset.yaml, we can run the following comand to run both of them:
kubectl apply -f mongo-statefulset.yaml
You should receive the following output:
service "mongo" created
statefulset "mongo" created
Connect to the MongoDB Replica Set
Now that we have a cluster running and our replica set deployed, let’s go ahead and connect to it.
Wait for the MongoDB replica set to be fully deployed
Kubernetes StatefulSets deploys each pod sequentially. It waits for the MongoDB replica set member to fully boot up and create the backing disk before starting the next member. Run the following command to view and confirm that all three members are up:
kubectl get statefulset
Output - all three members are up.
NAME      DESIRED   CURRENT   AGE
mongo     3         3         3m
Initiating and Viewing the MongoDB replica set
At this point, you should have three pods created in your cluster. These correspond to the three nodes in your MongoDB replica set. Run this command to view:
kubectl get pods
(Output):
NAME        READY     STATUS    RESTARTS   AGE
mongo-0     2/2       Running   0          3m
mongo-1     2/2       Running   0          3m
mongo-2     2/2       Running   0          3m
Wait for all three members to be created before moving on.
Connect to the first replica set member:
kubectl exec -ti mongo-0 mongo
You now have a REPL environment connected to the MongoDB .
Let’s instantiate the replica set with a default configuration by running the rs.initiate() command:
rs.initiate()
Print the replica set configuration; run the rs.conf() command:
rs.conf()
This outputs the details for the current member of replica set rs0. In this lab you see only one member. To get details of all members you need to expose the replica set through additional services like nodeport or load balancer.
rs0:OTHER> rs.conf()
{
        "_id" : "rs0",
        "version" : 1,
        "protocolVersion" : NumberLong(1),
        "writeConcernMajorityJournalDefault" : true,
        "members" : [
                {
                        "_id" : 0,
                        "host" : "localhost:27017",
                        "arbiterOnly" : false,
                        "buildIndexes" : true,
                        "hidden" : false,
                        "priority" : 1,
                        "tags" : {
                        },
                        "slaveDelay" : NumberLong(0),
                        "votes" : 1
                }
        ],
        "settings" : {
                "chainingAllowed" : true,
                "heartbeatIntervalMillis" : 2000,
                "heartbeatTimeoutSecs" : 10,
                "electionTimeoutMillis" : 10000,
                "catchUpTimeoutMillis" : -1,
                "catchUpTakeoverDelayMillis" : 30000,
                "getLastErrorModes" : {
                },
                "getLastErrorDefaults" : {
                        "w" : 1,
                        "wtimeout" : 0
                },
                "replicaSetId" : ObjectId("5c526b6501fa2d29fc65c48c")
        }
}
Type “exit” and press enter to quit the REPL.
Scaling the MongoDB replica set
A big advantage of Kubernetes and StatefulSets is that you can scale the number of MongoDB Replicas up and down with a single command!
To scale up the number of replica set members from 3 to 5, run this command:
kubectl scale --replicas=5 statefulset mongo
In a few minutes, there will be 5 MongoDB pods. Run this command to view them:
kubectl get pods
To scale down the number of replica set members from 5 back to 3, run this command:
kubectl scale --replicas=3 statefulset mongo
In a few seconds, there are 3 MongoDB pods. Run this command to view:
kubectl get pods
Your output should look like this:
NAME      READY     STATUS    RESTARTS   AGE
mongo-0   2/2       Running   0          41m
mongo-1   2/2       Running   0          39m
mongo-2   2/2       Running   0          37m
Using the MongoDB replica set
Each pod in a StatefulSet backed by a Headless Service will have a stable DNS name. The template follows this format:
This means the DNS names for the MongoDB replica set are:
mongo-0.mongo
mongo-1.mongo
mongo-2.mongo
You can use these names directly in the connection string URI of your app.
Using a database is outside the scope of this lab, however for this case, the connection string URI would be:
"mongodb://mongo-0.mongo,mongo-1.mongo,mongo-2.mongo:27017/dbname_?"
Clean up
Because you are working in Qwiklabs, when you end the lab all your resources and your project will be cleaned up and discarded on your behalf. But we want to show you how to clean up resources yourself to save on cost and to be a good cloud citizen when you are in your own environment.
To clean up the deployed resources, run the following commands to delete the StatefulSet, Headless Service, and the provisioned volumes.
Delete the StatefulSet:
kubectl delete statefulset mongo
Delete the service:
kubectl delete svc mongo
Delete the volumes:
kubectl delete pvc -l role=mongo
Finally, you can delete the test cluster:
gcloud container clusters delete "hello-world"
Press Y then Enter to continue deleting the test cluster.
Kubeflow End to End
Overview
Kubeflow is a machine learning toolkit for Kubernetes. The project is dedicated to making deployments of machine learning (ML) workflows on Kubernetes simple, portable, and scalable. The goal is to provide a straightforward way to deploy best-of-breed open-source systems for ML to diverse infrastructures.
A Kubeflow deployment is:
- Portable - Works on any Kubernetes cluster, whether it lives on Google Cloud Platform (GCP), on-premise, or across providers.
- Scalable - Can utilize fluctuating resources and is only constrained by the number of resources allocated to the Kubernetes cluster.
- Composable - Enhanced with service workers to work offline or on low-quality networks
Kubeflow will let you organize loosely-coupled microservices as a single unit and deploy them to a variety of locations, whether that’s a laptop or the cloud. This codelab will walk you through creating your own Kubeflow deployment.
What you’ll build
In this lab you’re going to build a web app that summarizes GitHub issues using a trained model. Upon completion, your infrastructure will contain:
A Kubernetes Engine cluster with standard Kubeflow and Seldon Core installations. A training job that uses Tensorflow to generate a Keras model. A serving container that provides predictions. A UI that uses the trained model to provide summarizations for GitHub issues.
What you’ll learn
- How to install Kubeflow.
- How to run training using the Tensorflow job server to generate a Keras model.
- How to serve a trained model with Seldon Core.
- How to generate and use predictions from a trained model.
What you’ll need
- A basic understanding of Kubernetes.
- A GitHub account.
Set up
Enable Boost Mode
In the Cloud Shell window, click on the Settings icon at the far right. Select Enable Boost Mode and then select “Restart Cloud Shell in Boost Mode”. This will provision a larger instance for your Cloud Shell session, resulting in speedier Docker builds.
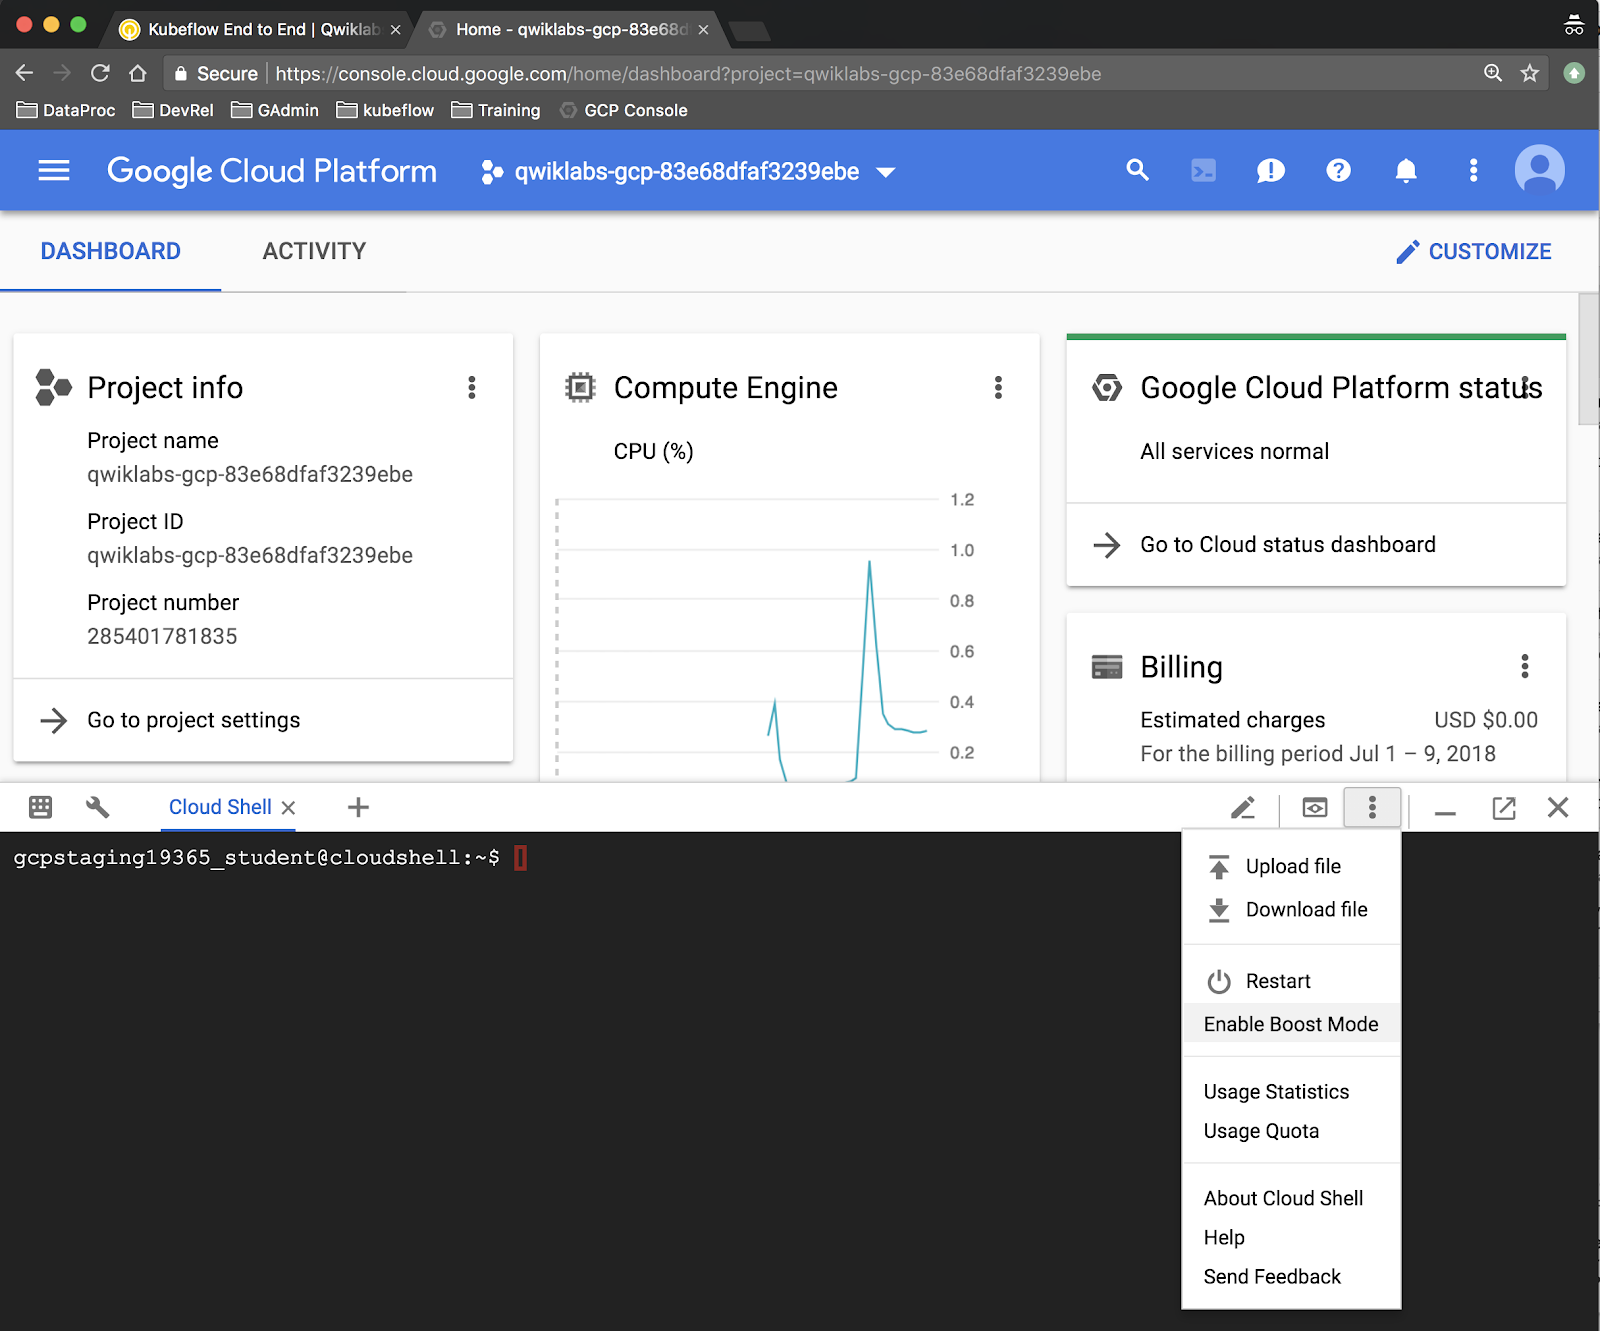
Download the project files Set the correct version and an environment variable:
export KUBEFLOW_TAG=0.4.0-rc.2
Once your Cloud Shell has been provisioned, run the following commands to download and unpack an archive of the Kubeflow examples repo, which contains all of the official Kubeflow examples:
git clone https://github.com/kubeflow/examples.git
cd examples
git checkout v${KUBEFLOW_TAG}
Set your GitHub token
This lab involves the use of many different files obtained from public repos on GitHub. To prevent rate-limiting, especially at events where a large number of anonymized requests are sent to the GitHub APIs, you will set up an access token with no permissions. This is simply to authorize you as an individual rather than anonymous user.
Sign into your GitHub account in a new tab, then navigate to: https://github.com/settings/tokens.
Click Generate a new token, select no permissions.
Click on the Copy icon.
Back in Cloud Shell, set the GITHUB_TOKEN environment variable, replacing <token> with your GitHub token:
export GITHUB_TOKEN=<token>
export GITHUB_TOKEN=a10a849c8ef485571de2d9d429f6796f2e3fa3e9
Install pyyaml
Ensure that pyyaml is installed by running:
pip install --user pyyaml
Install ksonnet
Set the correct version as an environment variable:
export KS_VER=0.13.1
export KS_BIN=ks_${KS_VER}_linux_amd64
Download and unpack ksonnet, then add it to your $PATH:
wget -O /tmp/${KS_BIN}.tar.gz https://github.com/ksonnet/ksonnet/releases/download/v${KS_VER}/${KS_BIN}.tar.gz
mkdir -p ${HOME}/bin
tar -xvf /tmp/${KS_BIN}.tar.gz -C ${HOME}/bin
export PATH=$PATH:${HOME}/bin/${KS_BIN}
Note: To familiarize yourself with ksonnet concepts, see this diagram.
Install kfctl
Download and unpack kfctl, the Kubernetes command-line tool, then add it to your $PATH:
wget -P /tmp https://github.com/kubeflow/kubeflow/archive/v${KUBEFLOW_TAG}.tar.gz
mkdir -p ${HOME}/src
tar -xvf /tmp/v${KUBEFLOW_TAG}.tar.gz -C ${HOME}/src
cd ${HOME}/src/kubeflow-${KUBEFLOW_TAG}/scripts
ln -s kfctl.sh kfctl
export PATH=$PATH:${HOME}/src/kubeflow-${KUBEFLOW_TAG}/scripts
cd ${HOME}
kubectl allows you to run commands against Kubernetes clusters, deploy applications, inspect and manage cluster resources, and view logs.
Set your GCP project ID
Store your Project ID as an environment variable:
export PROJECT_ID=<gcp_project_id>
export PROJECT_ID=qwiklabs-gcp-86fddff50e06d8bf
Activate the latest scopes in Kubernetes Engine:
export ZONE=us-central1-a
gcloud config set project ${PROJECT_ID}
gcloud config set compute/zone ${ZONE}
gcloud config set container/new_scopes_behavior true
Authorize Docker
Allow Docker access to your project’s Container Registry:
gcloud auth configure-docker
Enter in Y when promted to update the Docker configuration file.
Create a service account
Create a service account with read/write access to storage buckets:
export SERVICE_ACCOUNT=user-gcp-sa
export SERVICE_ACCOUNT_EMAIL=${SERVICE_ACCOUNT}@${PROJECT_ID}.iam.gserviceaccount.com
gcloud iam service-accounts create ${SERVICE_ACCOUNT} \
  --display-name "GCP Service Account for use with kubeflow examples"
gcloud projects add-iam-policy-binding ${PROJECT_ID} --member \
  serviceAccount:${SERVICE_ACCOUNT_EMAIL} \
  --role=roles/storage.admin
Generate a credentials file for upload to the cluster:
export KEY_FILE=${HOME}/secrets/${SERVICE_ACCOUNT_EMAIL}.json
gcloud iam service-accounts keys create ${KEY_FILE} \
  --iam-account ${SERVICE_ACCOUNT_EMAIL}
Create a storage bucket
Create a Cloud Storage bucket for storing your trained model and issue the mb (make bucket) command:
export BUCKET_NAME=kubeflow-${PROJECT_ID}
gsutil mb -c regional -l us-central1 gs://${BUCKET_NAME}
Click Check my progress to verify the objective.
Create a cluster
Create a managed Kubernetes cluster on Kubernetes Engine by running:
kfctl init kubeflow-qwiklab --platform gcp --project ${PROJECT_ID}
(Enabling services can take several minutes.)
cd kubeflow-qwiklab
kfctl generate platform
sed -i 's/n1-standard-8/n1-standard-4/g' gcp_config/cluster.jinja
kfctl apply platform
Cluster creation will take a few minutes to complete.
Ignore the error about setting CLIENT_ID. In the interest of time, you are skipping this step.
To verify the connection, run the following command:
kubectl cluster-info
Verify that this IP address matches the IP address corresponding to the Endpoint in your Google Cloud Platform Console by comparing the Kubernetes master IP is the same as the Master_IP address in the previous step.
Upload service account credentials
kubectl create secret generic user-gcp-sa \
  --from-file=user-gcp-sa.json="${KEY_FILE}"
Install Kubeflow
Next, install Kubeflow:
kfctl generate k8s
kfctl apply k8s
Installing Kubeflow will take several minutes.
ksonnet is a templating framework which allows you to utilize common object definitions and customize them to your environment. You’ll begin by referencing Kubeflow templates and apply environment-specific parameters. Once manifests have been generated specifically for your cluster, they can be applied like any other Kubernetes object using kubectl.
Add Seldon to the default installation
Run the following to install Seldon:
cd ${HOME}/kubeflow-qwiklab/ks_app
ks generate seldon seldon
ks apply default -c seldon
Your cluster now contains a Kubernetes installation with Seldon, which has the following components:
- Reverse HTTP proxy (Ambassador)
- Central dashboard
- Jupyterhub
- TF job dashboard
- TF job operator
- Seldon cluster manager
- Seldon cache
You can view the components by running:
kubectl get pods
Note: Image pulls can take a while. You can expect pods to remain in ContainerCreating status for a few minutes.
You should see output similar to this:
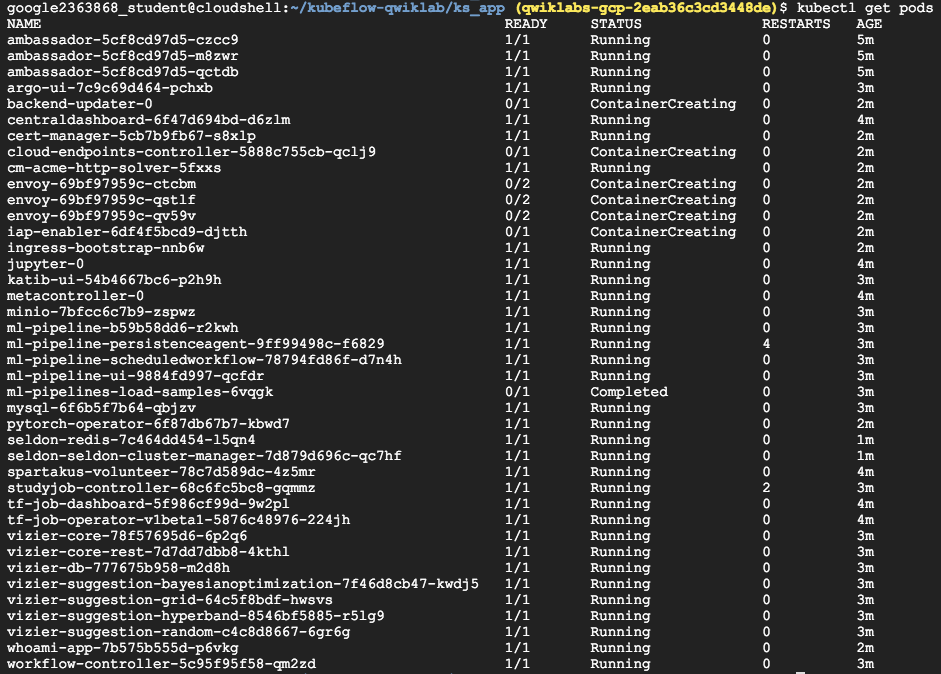
Train a model
In this section, you will create a component that trains a model.
Set the component parameters:
cd ${HOME}/kubeflow-qwiklab/ks_app
ks generate tf-job-simple-v1beta1 tfjob --name tfjob-issue-summarization
cp ${HOME}/examples/github_issue_summarization/ks_app/components/tfjob.jsonnet components/
ks param set tfjob gcpSecretName "user-gcp-sa"
ks param set tfjob gcpSecretFile "user-gcp-sa.json"
ks param set tfjob image "gcr.io/kubeflow-examples/tf-job-issue-summarization:v20180629-v0.1-2-g98ed4b4-dirty-182929"
ks param set tfjob input_data "gs://kubeflow-examples/github-issue-summarization-data/github_issues_sample.csv"
ks param set tfjob input_data_gcs_bucket "kubeflow-examples"
ks param set tfjob input_data_gcs_path "github-issue-summarization-data/github-issues.zip"
ks param set tfjob num_epochs "7"
ks param set tfjob output_model "/tmp/model.h5"
ks param set tfjob output_model_gcs_bucket "${BUCKET_NAME}"
ks param set tfjob output_model_gcs_path "github-issue-summarization-data"
ks param set tfjob sample_size "100000"
The training component tfjob is now configured to use a pre-built container image.
Launch training
Ensure that you are in the proper working directory by running the following command:
cd ${HOME}/kubeflow-qwiklab/ks_app
Apply the component manifests to the cluster:
ks apply default -c tfjob
View the running job
View the resulting pods:
kubectl get pod -l tf_job_name=tfjob-issue-summarization
Your cluster state should look similar to this:

It can take a few minutes to pull the image and start the container. Re-run the command until you see the status is Running.
Once tfjob-issue-summarization-master-0 is running, tail the logs:
kubectl logs -f tfjob-issue-summarization-master-0
Inside the pod, you will see the download of source data (github-issues.zip) before training begins. Continue tailing the logs until the pod exits on its own and you find yourself back at the command prompt.
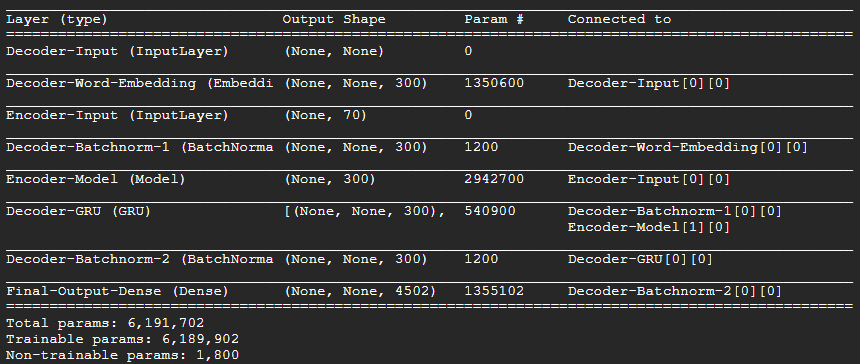
To verify that training completed successfully, check to make sure all three model files were uploaded to your Cloud Storage bucket:
gsutil ls gs://${BUCKET_NAME}/github-issue-summarization-data
You should see something like this:
gs://kubeflow-qwiklabs-gcp-bfa3ed6267fb8997/github-issue-summarization-data/body_pp.dpkl
gs://kubeflow-qwiklabs-gcp-bfa3ed6267fb8997/github-issue-summarization-data/seq2seq_model_tutorial.h5
gs://kubeflow-qwiklabs-gcp-bfa3ed6267fb8997/github-issue-summarization-data/title_pp.dpkl
Serve the trained model
Next you will create a component that serves a trained model.
Set component parameters:
export SERVING_IMAGE=gcr.io/kubeflow-examples/issue-summarization-model:v20180718-g98ed4b4-qwiklab
Create the serving component
The serving component is configured to run a pre-built image. Using a Seldon ksonnet template, generate the serving component.
Navigate back to the ksonnet app directory for Kubeflow, and issue the following command:
cd ${HOME}/kubeflow-qwiklab/ks_app
ks generate seldon-serve-simple-v1alpha2 issue-summarization-model \
  --name=issue-summarization \
  --image=${SERVING_IMAGE} \
  --replicas=2
Launch serving
Apply the component manifests to the cluster:
ks apply default -c issue-summarization-model
View the running pods
You will see several new pods appear:
kubectl get pods -l seldon-deployment-id=issue-summarization
(Output)

Your cluster state should look similar to this:
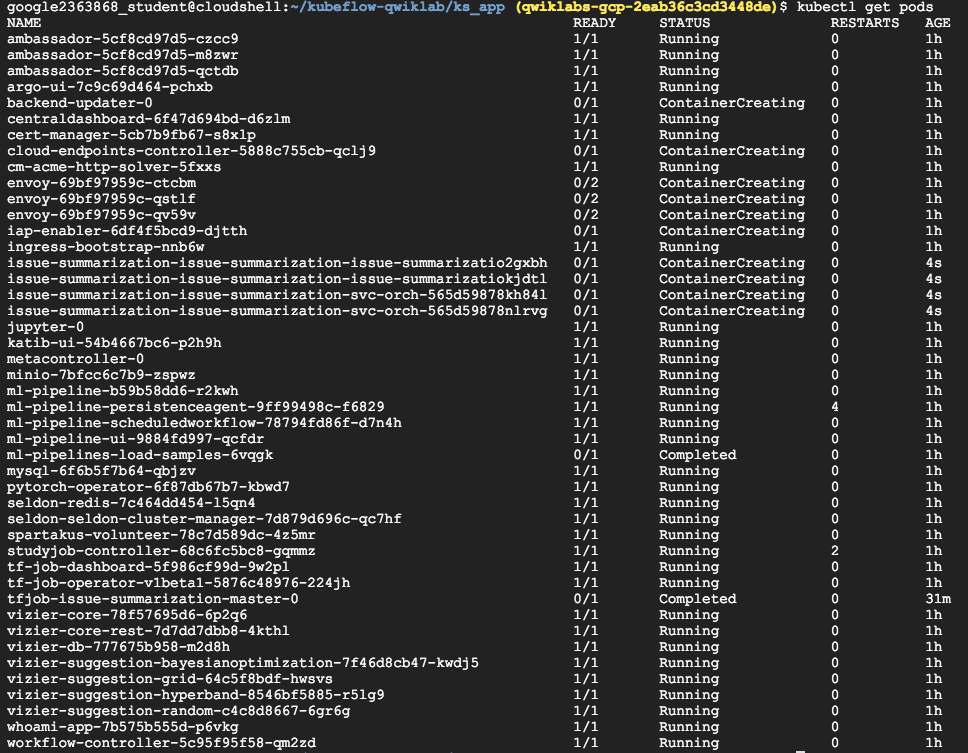
Wait a minute or two and re-run the previous command. Once the pods are running, run the following command to view the logs for one of the serving containers to verify that it is running on port 9000:
kubectl logs \
  $(kubectl get pods \
    -lseldon-deployment-id=issue-summarization \
    -o=jsonpath='{.items[0].metadata.name}') \
  issue-summarization
You should see a similar output:
* Running on http://0.0.0.0:9000/ (Press CTRL+C to quit)
Add a UI
In this section, you will create a component that provides browser access to the serving component.
Set parameter values
cd ${HOME}/kubeflow-qwiklab/ks_app
ks generate deployed-service ui \
  --name issue-summarization-ui \
  --image gcr.io/kubeflow-examples/issue-summarization-ui:v20180629-v0.1-2-g98ed4b4-dirty-182929

cp ${HOME}/examples/github_issue_summarization/ks_app/components/ui.jsonnet components/

ks param set ui githubToken ${GITHUB_TOKEN}
ks param set ui modelUrl "http://issue-summarization.kubeflow.svc.cluster.local:8000/api/v0.1/predictions"
The UI component is now configured to use a pre-built container image which is made available in Container Registry (gcr.io).
Note: If you would prefer to generate your own image instead, continue with the (Optional) Create the UI Image step. Otherwise, continue with Launch the UI.
(Optional) Create the UI image
Image creation can take 5-10 minutes. This step is optional. Alternatively, skip directly to the Launch the UI section below.
Switch to the docker directory and build the image for the UI:
cd ${HOME}/examples/github_issue_summarization/docker
docker build -t gcr.io/${PROJECT_ID}/issue-summarization-ui:latest .
After the image has been successfully built, store it in Container Registry:
docker push gcr.io/${PROJECT_ID}/issue-summarization-ui:latest
Update the component parameter with a link that points to the custom image:
cd ${HOME}/kubeflow-qwiklab/ks_app
ks param set ui image gcr.io/${PROJECT_ID}/issue-summarization-ui:latest
Launch the UI
Apply the component manifests to the cluster:
ks apply default -c ui
You should see an additional pod with the status ContainerCreating:
kubectl get pods -l app=issue-summarization-ui

View the UI
To view the UI, open a port to the ambassador service:
kubectl port-forward svc/ambassador 8080:80
In Cloud Shell, click on the Web Preview button and select “Preview on port 8080.”
This will open a new browser tab that shows the Kubeflow Central Dashboard. Add the text “issue-summarization/” to the end of the URL and press Enter (don’t forget the trailing slash).
You should see something like this:
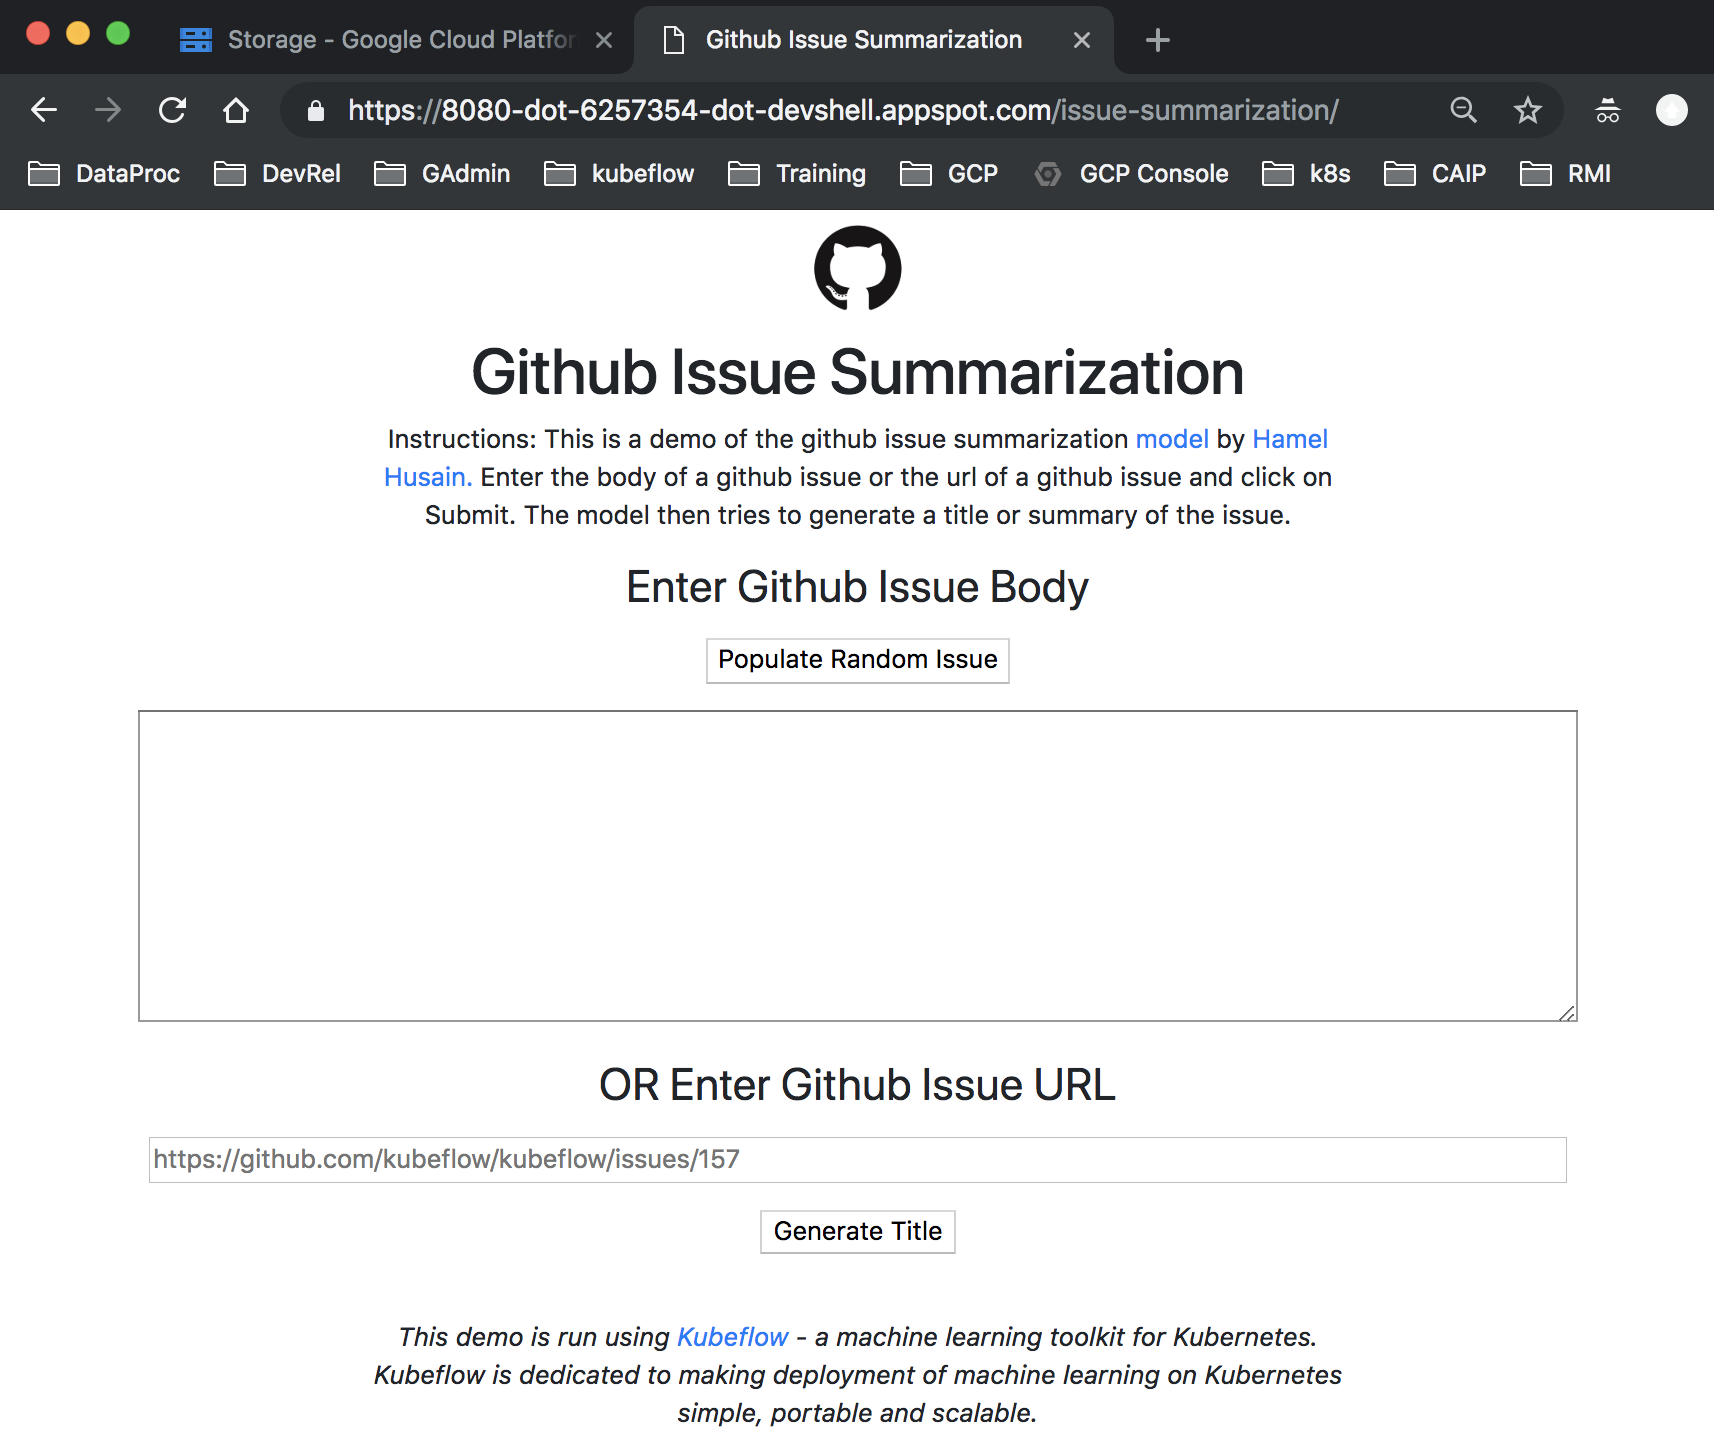
Click the Populate Random Issue button to fill in the large text box with a random issue summary. Then click the Generate Title button to view the machine generated title produced by your trained model. Click the button a couple of times to give yourself some more data to look at in the next step.
View serving container logs
In Cloud Shell, tail the logs of one of the serving containers to verify that it is receiving a request from the UI and providing a prediction in response:
kubectl logs -f \
  $(kubectl get pods \
    -lseldon-deployment-id=issue-summarization \
    -o=jsonpath='{.items[0].metadata.name}') \
  issue-summarization
Back in the UI, press the Generate Title button a few times to view the POST request in Cloud Shell. Since there are two serving containers, you might need to try a few times before you see the log entry.
google3528628_student@cloudshell:~/kubeflow-qwiklab/ks_app (qwiklabs-gcp-86fddff50e06d8bf)$ kubectl logs -f \
>   $(kubectl get pods \
>     -lseldon-deployment-id=issue-summarization \
>     -o=jsonpath='{.items[0].metadata.name}') \
>   issue-summarization
Using TensorFlow backend.
body_pp file body_pp.dpkl
title_pp file title_pp.dpkl
model file seq2seq_model_tutorial.h5
2019-05-29 23:57:43.232121: I tensorflow/core/platform/cpu_feature_guard.cc:141] Your CPU supports instructions that this
 TensorFlow binary was not compiled to use: AVX2 FMA
 * Running on http://0.0.0.0:9000/ (Press CTRL+C to quit)
10.40.0.34 - - [30/May/2019 00:07:57] "POST /predict HTTP/1.1" 200 -
10.40.1.25 - - [30/May/2019 00:08:35] "POST /predict HTTP/1.1" 200 -
10.40.1.25 - - [30/May/2019 00:09:01] "POST /predict HTTP/1.1" 200 -
Clean up
Remove GitHub token Navigate to https://github.com/settings/tokens and remove the token you generated for this lab.
Delete the Cluster
In Cloud Shell, run the following command to delete the cluster:
gcloud container clusters delete kubeflow-qwiklab –zone=us-central1-a
Sample output:
The following clusters will be deleted.
 - [kubeflow-qwiklab] in [us-central1-a]

Do you want to continue (Y/n)?  Y

Deleting cluster kubeflow-qwiklab...done.
Deleted [https://container.googleapis.com/v1/projects/qwiklabs-gcp-419184863edcf031/zones/us-central1-a/clusters/kubeflow-qwiklab]
Deploy a Web App on GKE with HTTPS Redirect using Lets Encrypt
Introduction
GKE does not provide a managed HTTPS offering, so it can be a bit daunting trying to take on the task of obtaining a valid TLS certificate without prior experience. You will need to find a Certificate Authority (CA) to provide a browser-trusted certificate and you need a way to manage those certificates.
With Let’s Encrypt, you have access to a free, automated, and open certificate authority (CA), run for the public’s benefit. Let’s Encrypt provides a browser-trusted certificate for your web services. In combination with cert-manager, a Kubernetes add-on, the management and issuance of TLS certificates from Let’s Encrypt will be completely automated.
Since GKE also lacks built-in HTTP to HTTPs redirect for Google Cloud Load Balancers (GCLB), an NGINX ingress will be deployed to handle HTTP to HTTPs redirect.
What you will build
In this lab, you’re going to deploy a containerized web app in a GKE cluster with HTTPS using a browser-trusted TLS certificate and NGINX to route all HTTP traffic to HTTPS. Google Cloud Endpoints is used for its ability to dynamically provision DNS entries under cloud.goog DNS domain.
What you’ll learn
In this lab you’ll learn how to do the following:
- Deploy a containerized web app
- Set up an NGINX ingress for HTTP to HTTPS redirect
- Install a cert-manager into a cluster to automate getting TLS/SSL certificates
- Deploy/modify an ingress with TLS enabled
What you’ll need
- A recent version of Chrome is recommended
- Basic knowledge of Linux CLI and gcloud This lab is focused on GKE deployment and management. Non-relevant concepts and code blocks are glossed over and are provided for you to simply copy and paste.
Download the source code
In Cloud Shell, download the source code for the lab:
wget https://storage.googleapis.com/vwebb-codelabs/gke-tls-qwik/gke-tls-lab.tar.gz
Unpack the file to your local system and navigate to the source code directory:
tar zxfv gke-tls-lab.tar.gz

cd gke-tls-lab
Configure Cloud Endpoints
Allocate a Static IP
First, allocate a static IP in the GCP region our cluster resides using the following command:
gcloud compute addresses create endpoints-ip --region us-central1
Verify an address is allocated:
gcloud compute addresses list
The IP address in the output is the allocated IP address. Record this IP address as you will use it throughout the lab.
Launch the Cloud Shell code editor
In this lab you’ll view and edit files. You can use the shell editors that are installed on Cloud Shell, such as nano or vim, or use the Cloud Shell code editor. This lab uses the Cloud Shell code editor.
Launch the Cloud Shell code editor by clicking the pencil icon:
Update openapi.yaml.
In the left pane in the code editor, navigate to gke-tls-lab/openapi.yaml.
Replace [MY-STATIC-IP] with the allocated IP address.
In the code, replace all instances of [MY-PROJECT] with your GCP Project ID and save openapi.yaml.
Deploy the Cloud Endpoints
Run the following command to deploy to Cloud Endpoints:
gcloud endpoints services deploy openapi.yaml
Create a Kubernetes Engine Cluster
In the command line, create a cluster by running the following command:
gcloud container clusters create cl-cluster --zone us-central1-f
It may take a few minutes to complete.
Authentication credentials for the cluster
You need authentication credentials to interact with the cluster.
Get authentication credentials:
gcloud container clusters get-credentials cl-cluster --zone us-central1-f
Set up Role-Based Access Control
To be able to deploy to the cluster, you need the proper permissions.
Assign yourself the cluster-admin role by running the following command:
kubectl create clusterrolebinding cluster-admin-binding \
--clusterrole cluster-admin --user $(gcloud config get-value account)
Install Helm
Helm is a Kubernetes package-manager that helps you manage Kubernetes applications that we will use in the lab to install our NGINX ingress and Let’s Encrypt.
Download and install Helm client:
curl https://raw.githubusercontent.com/kubernetes/helm/master/scripts/get > get_helm.sh

chmod 700 get_helm.sh

./get_helm.sh
Next, install the Helm server-side components (Tiller) on your GKE cluster by running the following command:
kubectl create serviceaccount -n kube-system tiller

kubectl create clusterrolebinding tiller-binding \
    --clusterrole=cluster-admin \
    --serviceaccount kube-system:tiller

helm init --service-account tiller
Now update Helm’s chart repositories:
helm repo update
Install NGINX Ingress
You will deploy an NGINX ingress using Helm to handle our HTTP to HTTPS redirect when configure our web app for HTTPS to ensure the user always has a secure connection to our app.
Install the NGINX ingress using Helm by running the following command. Replace [MY-STATIC-IP] with the allocated IP address you recorded in a previous section.
helm install stable/nginx-ingress --set controller.service.loadBalancerIP="[MY-STATIC-IP]",rbac.create=true

helm install stable/nginx-ingress --set controller.service.loadBalancerIP="35.232.204.197",rbac.create=true
You can retrieve the allocated IP address by running:
gcloud compute addresses list
Deploy “Hello World” App
Now that the cluster is created, you can deploy the containerized “hello world” web app.
Update configmap.yaml
The file configmap.yaml contains the environment variable used by Cloud Endpoints.
In the code editor, navigate to configmap.yaml and replace [MY-PROJECT] with your GCP Project ID.
Save the file.
Deploy web app to cluster
Run the following commands to deploy:
kubectl apply -f configmap.yaml

kubectl apply -f deployment.yaml
Now, we need to expose our deployment. We are going to expose our web app by first attaching a NodePort service by running the following command:
kubectl apply -f service.yaml
With our service created, we can now deploy an ingress to create a Google Cloud Load Balancer to reach our service externally. The ingress will include the following annotation:
kubernetes.io/ingress.class: nginx
This annotation will tell Kubernetes not to create a Google Cloud Load Balancer and to use our NGINX ingress controller instead.
Update ingress.yaml
In the code editor, navigate to ingress.yaml and replace all instances [MY-PROJECT] with your GCP Project ID.
Save the file
Apply the ingress and test
In the command line, apply the ingress:
kubectl apply -f ingress.yaml
Note: It might take 5-10 minutes for the ingress to be properly provisioned.
Test the application. Open a new browser window and connect to the address below, replacing [MY-PROJECT] with your GCP Project ID:
http://api.endpoints.[MY-PROJECT].cloud.goog
http://api.endpoints.qwiklabs-gcp-e78dda65259298d4.cloud.goog
You have successfully deployed the web app when you see the “Hello, world” message, version, and hostname displayed in the browser.
Now to configure the web app for HTTPS!
Set Up HTTPS
We will install cert-manager and configure Let’s Encrypt as our certificate issuer to obtain a browser-trusted TLS certificates that can be used to secure our application with HTTPS, and configure our existing esp-ingress to handle only HTTPS requests.
Set up Let’s Encrypt
We will use Helm to install cert-manager using the following command:
helm install --name cert-manager --version v0.3.2 \
    --namespace kube-system stable/cert-manager
Run the following command to set your email address in a variable:
export EMAIL=ahmet@example.com
Now we will deploy Let’s Encrypter issuer to issue TLS certificates. Deploy the Issuer manifest using the following command:
cat letsencrypt-issuer.yaml | sed -e "s/email: ''/email: $EMAIL/g" | kubectl apply -f-
Reconfigure ingress for HTTPS
We will now configure our existing esp-ingress with TLS. This is done by deploying the ingress modified version of our ingress.yaml, which is ingress-tls.yaml.
The file, ingress-tls.yaml modifies the ingress with the following additional annotations and modifications to the spec key:

annotations:

...

kubernetes.io/tls-acme: "true"

certmanager.k8s.io/cluster-issuer: letsencrypt-prod

ingress.kubernetes.io/ssl-redirect: "true"

spec:

tls:

- hosts:

- api.endpoints.[MY-PROJECT].cloud.goog

secretName: esp-tls

The annotations will tell cert-manager to begin automating the process of acquiring the required TLS certificate from Let's Encrypt, and will tell our NGINX ingress to redirect all HTTP traffic to HTTPS. The spec will include a "tls" key containing our hosts and secretName.
Update ingress-tls.yaml
Navigate to ingress-tls.yaml. Rename all instances of [MY-PROJECT] with your GCP Project ID and save the file.
Apply the updates
In the command line, apply the change to esp-ingress:
kubectl apply -f ingress-tls.yaml
Once again, you can check the status by running the following command:
kubectl describe ingress esp-ingress
You should see output similar to the following:
Events:
  Type    Reason             Age                From                      Message
  ----    ------             ----               ----                      -------
  Normal  CREATE             10m                nginx-ingress-controller  Ingress default/esp-ingress
  Normal  UPDATE             23s (x2 over 10m)  nginx-ingress-controller  Ingress default/esp-ingress
Note: It might take a few minutes for the ingress to be properly provisioned.
Test the application by connecting to the address below, replacing [MY-PROJECT] with your GCP Project ID:
http://api.endpoints.[MY-PROJECT].cloud.goog
Now, look at the address bar and you will notice that you are now utilizing a secure, encrypted HTTPS connection with a browser-trusted certificate!